I'm using master, but when I used a Pie chart, I received this error:
em System.ThrowHelper.ThrowArgumentOutOfRangeException(ExceptionArgument argument, ExceptionResource resource)
em Stimulsoft.Report.Chart.StiPieSeriesCoreXF.RenderSeries(StiContext context, RectangleF rect, StiAreaGeom geom, IStiSeries[] seriesArray) na D:\Stimulsoft\Stimulsoft.Reports\Stimulsoft.Report\Chart\Core\Series\Pie\StiPieSeriesCoreXF.cs:linha 610
em Stimulsoft.Report.Chart.StiPieAreaCoreXF.RenderSeries(StiContext context, RectangleF rect, StiAreaGeom geom, List`1 seriesCollection) na D:\Stimulsoft\Stimulsoft.Reports\Stimulsoft.Report\Chart\Core\Area\Pie\StiPieAreaCoreXF.cs:linha 85
em Stimulsoft.Report.Chart.StiPieAreaCoreXF.Render(StiContext context, RectangleF rect) na D:\Stimulsoft\Stimulsoft.Reports\Stimulsoft.Report\Chart\Core\Area\Pie\StiPieAreaCoreXF.cs:linha 57
em Stimulsoft.Report.Chart.StiChartCoreXF.Render(StiContext context, RectangleF rect, Boolean useMargins) na D:\Stimulsoft\Stimulsoft.Reports\Stimulsoft.Report\Chart\Core\StiChartCoreXF.cs:linha 140
em Stimulsoft.Report.Export.StiChartSvgHelper.WriteChart(XmlTextWriter writer, StiSvgData svgData, Single zoom, Boolean needAnimation) na D:\Stimulsoft\Stimulsoft.Reports\Stimulsoft.Report\Export\Services\Helpers\StiChartSvgHelper.cs:linha 72
em Stimulsoft.Report.Export.StiHtmlExportService.PrepareChartData(StiHtmlTextWriter writer, StiChart chart, Double width, Double height) na D:\Stimulsoft\Stimulsoft.Reports\Stimulsoft.Report\Export\Services\Htmls\StiHtmlExportService.cs:linha 2147
em Stimulsoft.Report.Export.StiHtmlTableRender.RenderTable(Boolean renderStyles, String backGroundImageString, Boolean useBookmarks, Boolean exportBookmarksOnly, Hashtable cssStyles, Boolean watermarkShowBehind) na D:\Stimulsoft\Stimulsoft.Reports\Stimulsoft.Report\Export\Tools\StiHtmlTableRender.cs:linha 1643
em Stimulsoft.Report.Export.StiHtmlExportService.ExportHtml(StiReport report, StiHtmlTextWriter writer, StiHtmlExportSettings settings, StiPagesCollection pages) na D:\Stimulsoft\Stimulsoft.Reports\Stimulsoft.Report\Export\Services\Htmls\StiHtmlExportService.cs:linha 3440
em Stimulsoft.Report.Export.StiHtmlExportService.ExportHtml(StiReport report, Stream stream, StiHtmlExportSettings settings) na D:\Stimulsoft\Stimulsoft.Reports\Stimulsoft.Report\Export\Services\Htmls\StiHtmlExportService.cs:linha 2554
em Stimulsoft.Report.Web.StiReportHelper.GetReportPage(StiReport report, StiHtmlExportService service, Int32 pageIndex, StiRequestParams requestParams) na D:\Stimulsoft\Stimulsoft.Reports\Stimulsoft.Report.Web\Helpers\StiReportHelper.cs:linha 809
em Stimulsoft.Report.Web.StiReportHelper.GetPagesArray(StiReport report, StiRequestParams requestParams) na D:\Stimulsoft\Stimulsoft.Reports\Stimulsoft.Report.Web\Helpers\StiReportHelper.cs:linha 852
em Stimulsoft.Report.Web.StiReportHelper.ViewerResult(StiRequestParams requestParams, StiReport report) na D:\Stimulsoft\Stimulsoft.Reports\Stimulsoft.Report.Web\Helpers\StiReportHelper.cs:linha 1012
em Stimulsoft.Report.Mvc.StiMvcViewer.GetReportResult(StiRequestParams requestParams, StiReport report) na D:\Stimulsoft\Stimulsoft.Reports\Stimulsoft.Report.Mvc\Viewer\StiMvcViewer.Actions.cs:linha 66
em Stimulsoft.Report.Mvc.StiMvcViewer.GetReportResult(StiReport report) na D:\Stimulsoft\Stimulsoft.Reports\Stimulsoft.Report.Mvc\Viewer\StiMvcViewer.Actions.cs:linha 54
em Cofco.Controllers.ViewerReportController.GetReport(Nullable`1 preliminarIncidenteId, Nullable`1 investigacaoIncidenteId, String reports) na C:\Projeto\COFCO\COFCO SSMA Oficial\SST-SP3_H4_HousekeepingPDF\Cofco\Controllers\ViewerReportController.cs:linha 198
But when I used "Column" its Ok
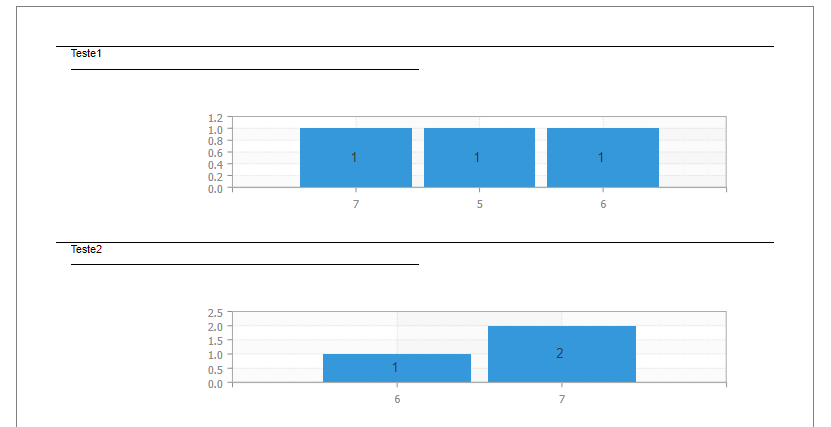
- VisualizationChartColumn.PNG (12.04 KiB) Viewed 3510 times
What can I do?