Page 1 of 1
Clustered Bar Chart - Show values as percentages of total
Posted: Mon Jul 01, 2019 7:18 pm
by JHenn
In a pie chart, each series value is presented as a percentage of the total.
We would like to do the same for a clustered bar chart. There is only a single series and it seems it should be doable. as the percentages would be the same as they are for the pie chart presentation. But I haven't figured out how. ('Show in Percent' changes the value formatting but does not present each value as a percentage of the total.) How can values in a clustered bar chart be shown as percents of the total series?
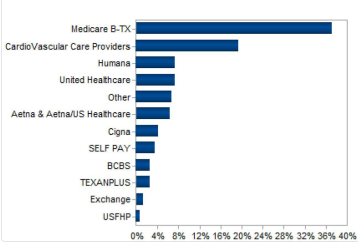
- 2019-07-01_15-15-19.png (36.74 KiB) Viewed 6329 times
Thank you,
Re: Clustered Bar Chart - Show values as percentages of total
Posted: Mon Jul 01, 2019 10:23 pm
by JHenn
I think I figured out a solution. If there is a more elegant way, please let me know.
1. Create a databand to support the summary values to be used in a DIV expression (can be the same dataset as the chart).
2. Define the source at the Chart level (Chart/Data Source).
3. Under Series, set the Argument Data Column to the appropriate data column.
4. Also under Series, use Value / Value (instead of Value / Value Data Column) to create a DIV expression that provides the needed percentage. Mine:
{Div (Dataset.Charges,Totals.Sum(DataDataset,Dataset.Charges))*100}
5. Format that percentage. Under Labels, check Show in Percent and set the format (I used P1).
Re: Clustered Bar Chart - Show values as percentages of total
Posted: Tue Jul 02, 2019 9:15 am
by Lech Kulikowski
Hello,
Thank you for the provided solution.
Thank you.
Re: Clustered Bar Chart - Show values as percentages of total
Posted: Sat May 01, 2021 5:58 pm
by Kiyaksar
Hi,
I have the same problem,
Can you help me with an example or video tutorial?
thanks
Re: Clustered Bar Chart - Show values as percentages of total
Posted: Mon May 03, 2021 8:05 am
by Kiyaksar
please help me
Explain more clearly number 4 in your Description,
this problem took me one week, but I couldn't solve it. What do u mean of 'DataDataset', where do I have to put this expression?
I have 3 columns (Mnth, DynamicCol, Counting) the third one is int and other columns are string
Re: Clustered Bar Chart - Show values as percentages of total
Posted: Tue May 04, 2021 7:08 am
by Lech Kulikowski
Hello,
Means the data source name. You should use your data source name instead of the "Dataset" in that expression.
Thank you.
Re: Clustered Bar Chart - Show values as percentages of total
Posted: Sat May 08, 2021 5:01 pm
by Kiyaksar
Thank u 4 ur answer
it was solved
Re: Clustered Bar Chart - Show values as percentages of total
Posted: Tue May 11, 2021 8:08 am
by Andrew
Okay, great!