Page 1 of 1
How to create/draw a histogram?
Posted: Wed Feb 26, 2020 2:55 pm
by lamthanha
Hi,
I want to create a histogram, like the ones in this link:
https://developers.google.com/chart/int ... /histogram
I browsed all the demo reports but found none that fitted.
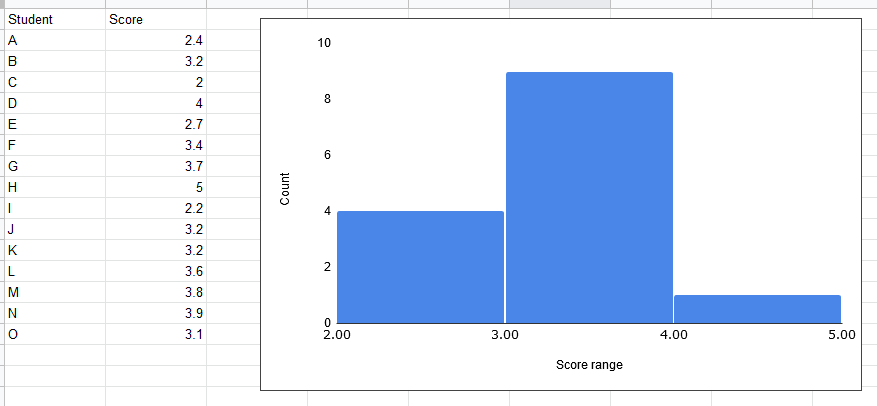
For example, I have a table in the left, and I want a histogram as the one to the right. How can I do that?

- Screenshot_18.png (12.32 KiB) Viewed 2749 times
Thank you.
Re: How to create/draw a histogram?
Posted: Thu Feb 27, 2020 9:04 pm
by Lech Kulikowski
Hello,
Yes, it is possible.
Please check sample reports with Charts on our Demo:
https://demo.stimulsoft.com/#Net/SimpleChart
Thank you.
Re: How to create/draw a histogram?
Posted: Fri Feb 28, 2020 2:09 am
by lamthanha
Hi Lech,
Thank you for your response.
I told you I had checked all your demo charts, none of them is a histogram, i.e., each column/bar represents data for a single entry, not a range.
Re: How to create/draw a histogram?
Posted: Mon Mar 02, 2020 11:35 am
by Lech Kulikowski
Hello,
Unfortunately, at the current moment, we do hot have histograms. We have added that task to our to-do list.
Thank you.
Re: How to create/draw a histogram?
Posted: Wed Apr 07, 2021 12:54 am
by gjabustamante
Hi,
Is this still not available?
If so, is there a workaround to do it?
Re: How to create/draw a histogram?
Posted: Thu Apr 08, 2021 8:25 am
by Lech Kulikowski
Hello,
Please check the last version.
Thank you.