Simplified Ribbon
In the latest update, we have included a feature that allows you to easily switch the Ribbon toolbar to a single line. To accomplish this, simply set the Ribbon Layout parameter to Single Line in the Options window of the report designer on the GUI tab. Alternatively, you can use the switch located in the lower right corner of the Ribbon toolbar. The simplified Ribbon consolidates all the necessary parameters and commands for creating and editing reports and dashboards.
Dashboards.ANGULAR
Вn the 2024.1.1 release, we are excited to introduce a comprehensive set of tools that are cross-platform and fully functional for designing, viewing, and converting dashboards for Angular platform versions 15 and higher. Stimulsoft Dashboards.ANGULAR leverages client-server technology, with swift Angular components operating on the client side and a robust data analytics engine on the server side, powered by frameworks such as .NET Framework 4.7.2 and higher, and .NET Core 3.1, .NET 6.0 and higher. Access to Dashboards.ANGULAR components is facilitated through subscription to Stimulsoft Ultimate or Dashboards.WEB, with separate packages available on NuGet (server side) and npm (client side).
Data adapter for Snowflake
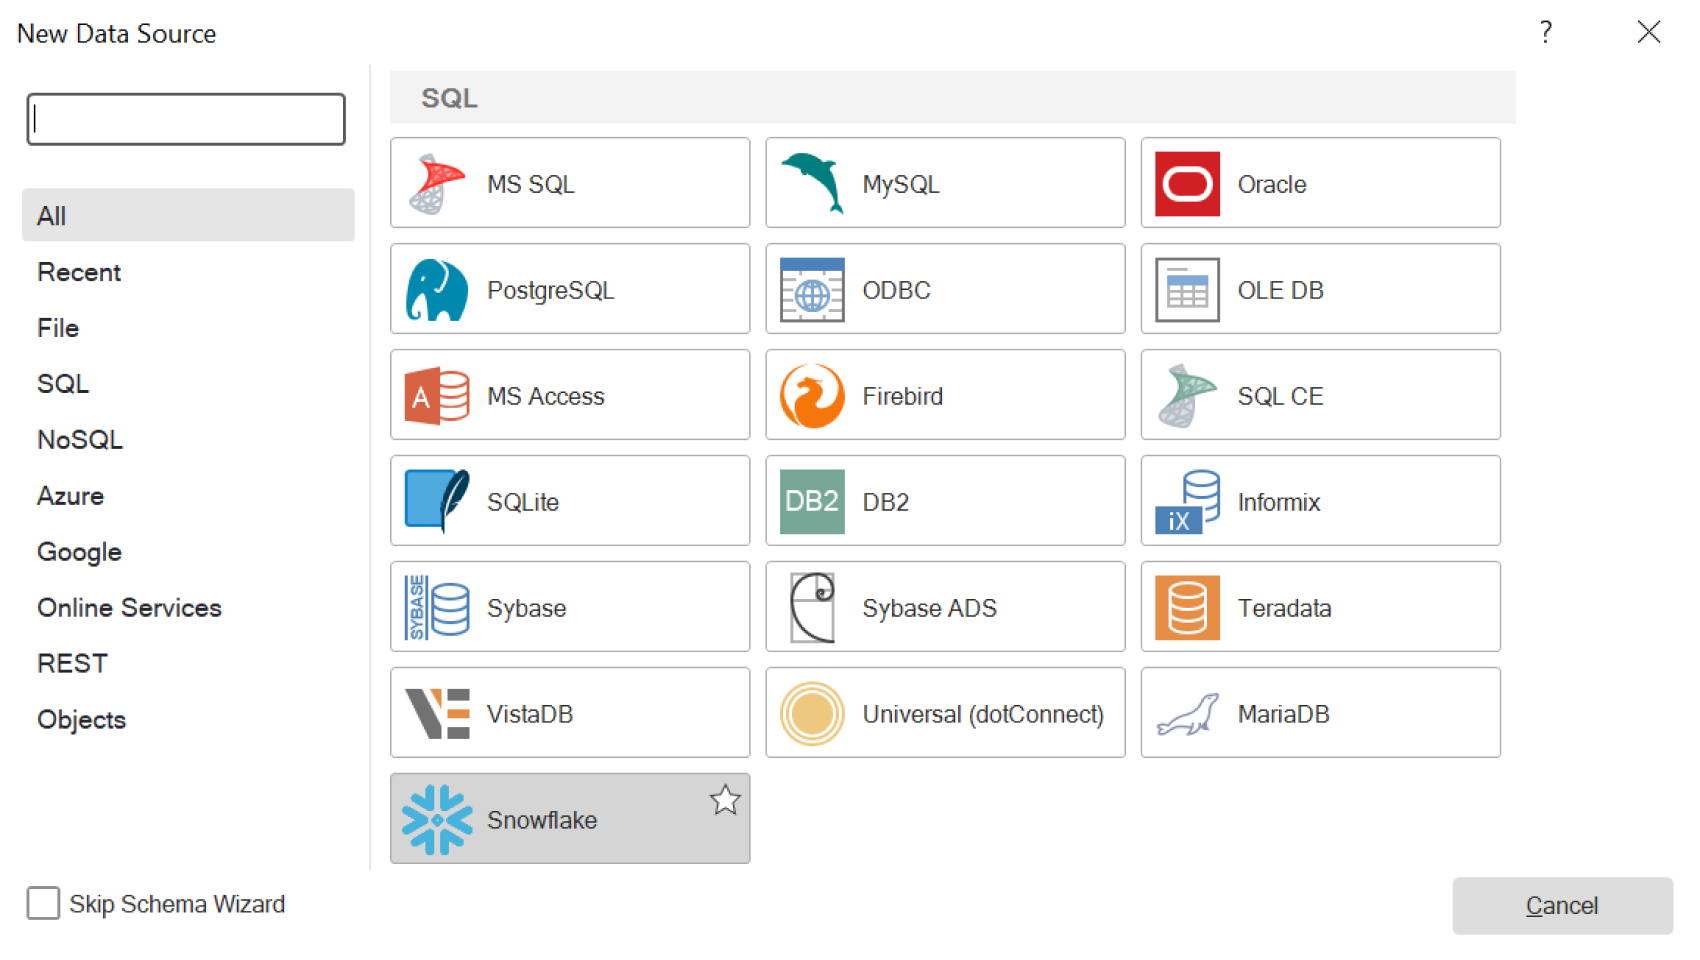
In this release, we have incorporated adapter support for fetching data from Snowflake storage. This functionality is also accessible in Stimulsoft Cloud. Snowflake stands out as one of the widely used cloud data storage services, adept at handling both semi-structured and structured data. To establish a data source, simply opt for Snowflake on the SQL tab within the New Data Source window. Once you have set up a connection and executed a selection request, you are all set to craft reports and dashboards using the acquired data.
Remembering variable selection
In version 2024.1.1, enhancements extend to variables involving user-inputted values during the viewing of reports and dashboards. Now, the system retains the last value inputted into the variable. You can configure this behavior in the variable editor by selecting the Remember Selection option. With this option checked, upon revisiting the report, the variable will default to the last user-entered value. It is important to note that if the user did not input a value previously, the variable will revert to its default setting.
КVersion quotas in BI Server
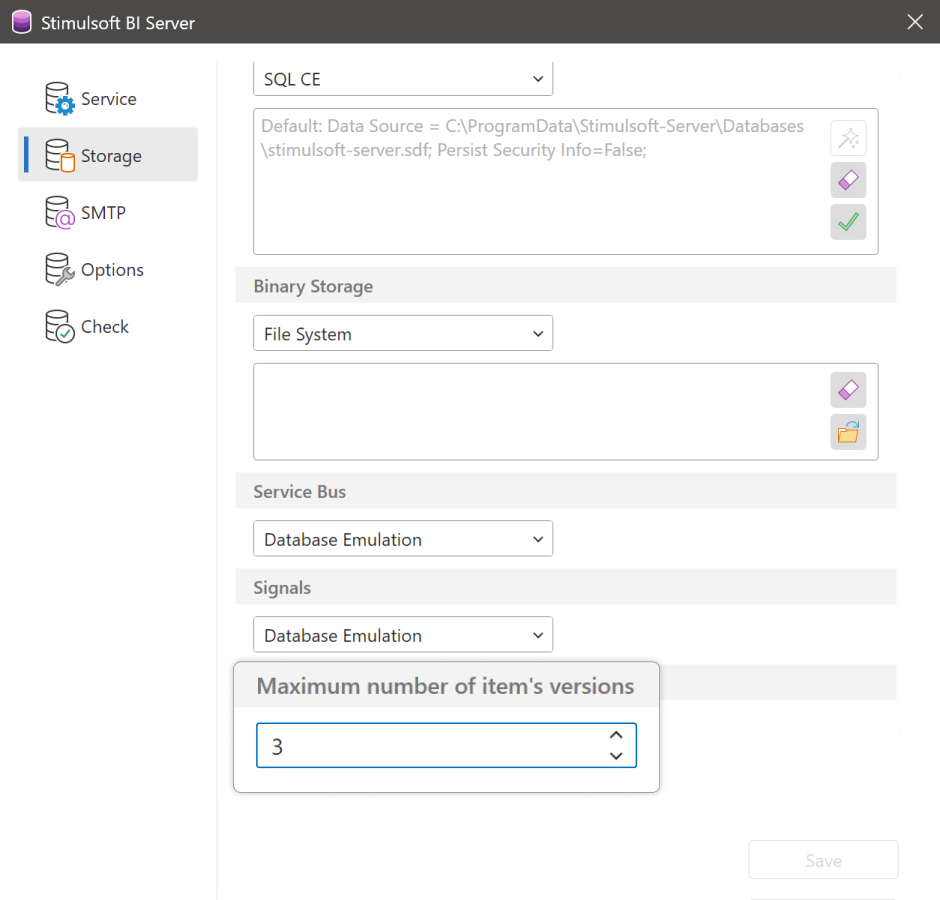
In this release, we have introduced the capability to define a quota for the number of stored versions of elements. You can set this quota by utilizing the Maximum number of item's versions option found on the Storage tab within the Server Controller. The minimum number of stored versions for elements can be set to 3, and there is no upper limit for the maximum number of versions.
Expression for Count Data
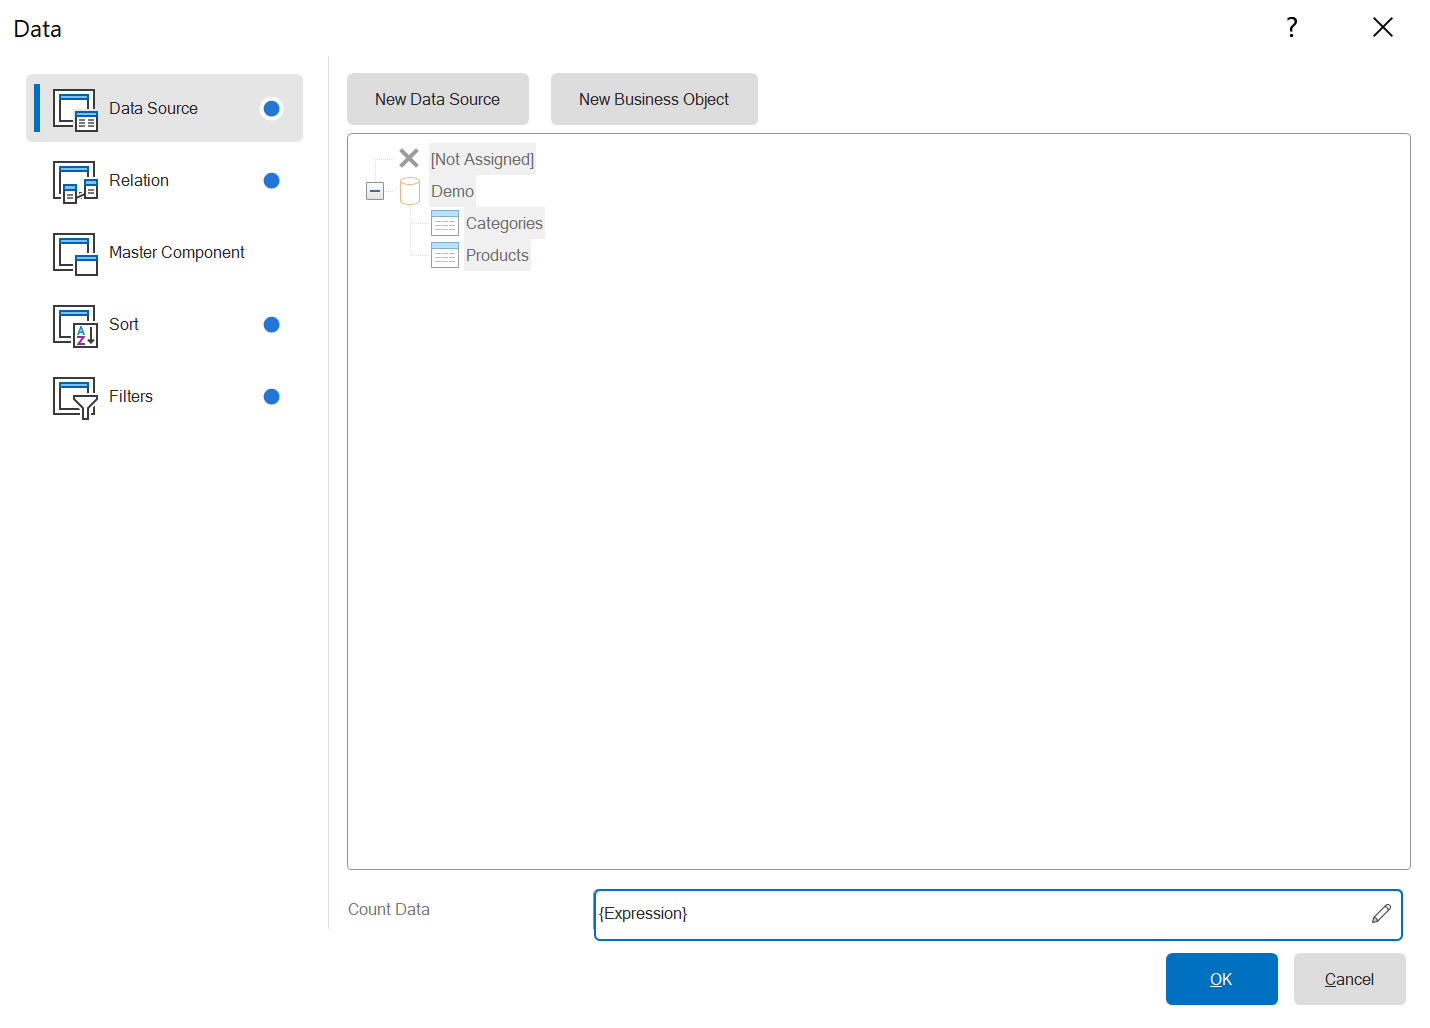
Introducing support for expressions in the Count Data parameter for Data, Hierarchical Data bands, and the Table component in reports. Previously, the Count Data parameter only allowed specification of a numeric value. Now, you can input any expression, and the calculated result will be a number. If the expression's result cannot be converted to a number, the band or component will be printed only once.
A map of Puerto Rico
In the 2024.1.1 release, we have included two new types of regional maps: Puerto Rico and USA+Puerto Rico. You can now leverage these maps in the development of reports and dashboards.
Data quotas for dashboards
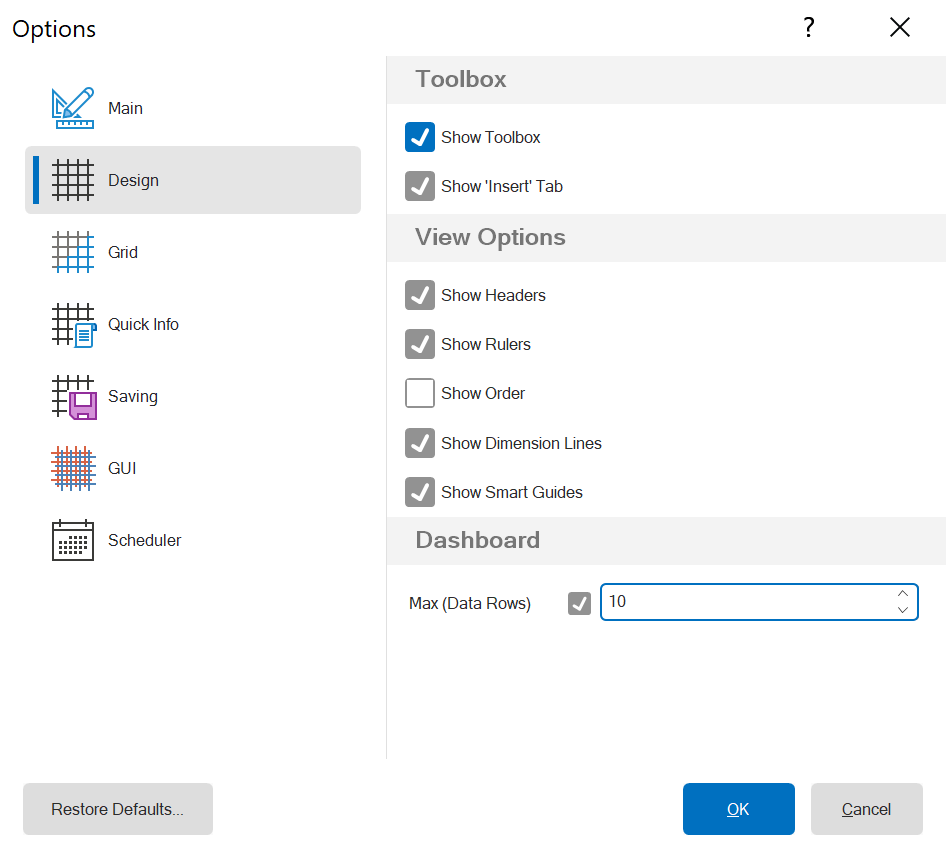
We have introduced the feature to set a quota for the number of data lines in dashboard elements during their creation and editing in the report designer. You can specify the quota for the number of data rows by adjusting the desired value for the Max (Data Rows) parameter in the Options window of the report designer on the Design tab. It is important to note that this parameter does not enforce the quota on the number of rows for these elements when viewing a dashboard. Additionally, it will only be accessible in the Settings window if a dashboard is present in the report template.
Custom filters
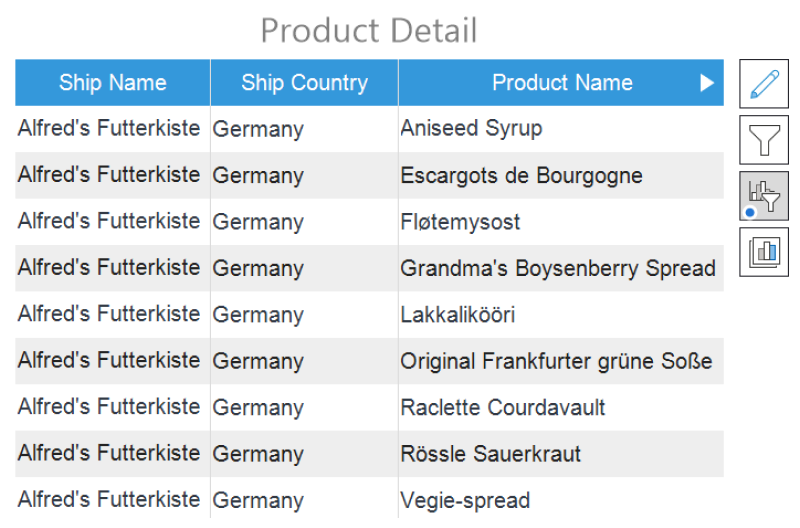
You now have the option to include custom filters for the Table element in dashboards. In earlier versions of our products, identifying the presence of a filter was reliant on a sometimes inconspicuous icon on the column header. Recognizing the need for clearer indicators, we have enhanced the labeling of custom filters for easier accessibility. With this improvement, when filters are applied to the Table element, an additional custom filter control element appears during dashboard editing in the report designer. Simply clicking this control enables quick modification or removal of user filters.
Updated import from DevExpress
In this release, we have crafted a new feature for importing reports in an XML-based format from DevExpress. Reports in the older CodeDOM-based format can exclusively be opened using DevExpress assemblies; therefore, importing reports in the old format is structured as a distinct project. The new import from DevExpress is integrated into Stimulsoft BI Designer and can be found on the Import tab within the Open section of the File menu.
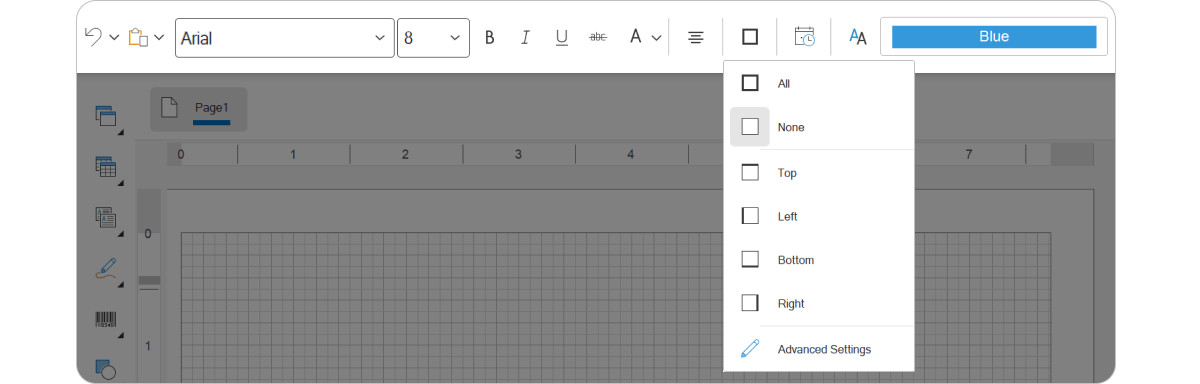
Rulers in the web designer
We have added Rulers to the web report designer. Despite its apparent simplicity, this tool greatly streamlines the process of creating and editing reports.