Page 5 of 6

Re: How can I implement custom chart colors?

Posted: Wed Jan 10, 2024 3:03 pm
by Lech Kulikowski
Hello,

Could you provide more detailed information on how to reproduce the issue?

Thank you.

Re: How can I implement custom chart colors?

Posted: Thu Jan 11, 2024 11:10 am
by lucasrinaldi
I don't know how to reproduce it. I just updated the apicore version and the report stopped working.
Trying to debug, I noticed that some null values are converted to empty quotes, and the client and our API are sending null. The problem is occurring in the report.
Is there a configuration that turns null into empty strings? I searched but found nothing.

Re: How can I implement custom chart colors?

Posted: Fri Jan 12, 2024 12:51 pm
by Lech Kulikowski
Hello,

Please send us a sample project that reproduces the issue for analysis.

Thank you.

Re: How can I implement custom chart colors?

Posted: Tue Jan 16, 2024 11:13 am
by lucasrinaldi
Lech, investigating, we noticed that one of our reports renders the colors correctly, and because of this breaking change on the update, we might not update them all because it would cost too much time for us.
The problem is very obscure and we cannot reproduce it. I will send the report so you can check the configurations, but the problem lies in the cross-data with the pie chart together. When the cross-data crosses the page and break the row, the color stops being rendered.

Re: How can I implement custom chart colors?

Posted: Wed Jan 17, 2024 12:43 am
by Lech Kulikowski
Hello,

We couldn't connect to the data in your report.

Thank you.

Re: How can I implement custom chart colors?

Posted: Wed Jan 17, 2024 1:47 pm
by lucasrinaldi
Lech, I don't know how can I provide the data correctly to you.
Can't you generate a new report and take the steps that I told you?
If a crossband component overflows the page, the chart stops rendering the color.

You need to put a crossband with multiple columns, so it overflows to the second page. Afterward, the report stops rendering colors.

Re: How can I implement custom chart colors?

Posted: Thu Jan 18, 2024 12:28 am
by Lech Kulikowski
Hello,

Could you prepare data for example as Excel file, add it to the resources, and prepare a sample report?

Thank you.

Re: How can I implement custom chart colors?

Posted: Mon Jan 22, 2024 8:07 pm
by lucasrinaldi
Hello Lech, sorry for the delay. We are building multiple features and our time is scarce.
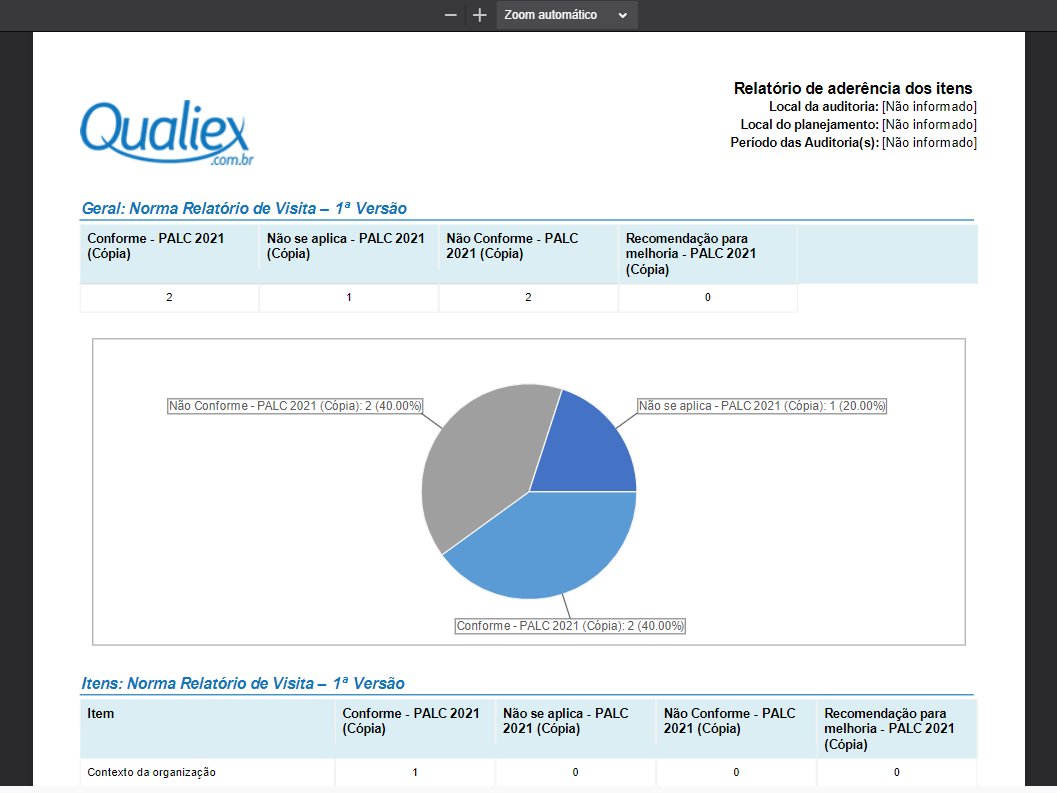
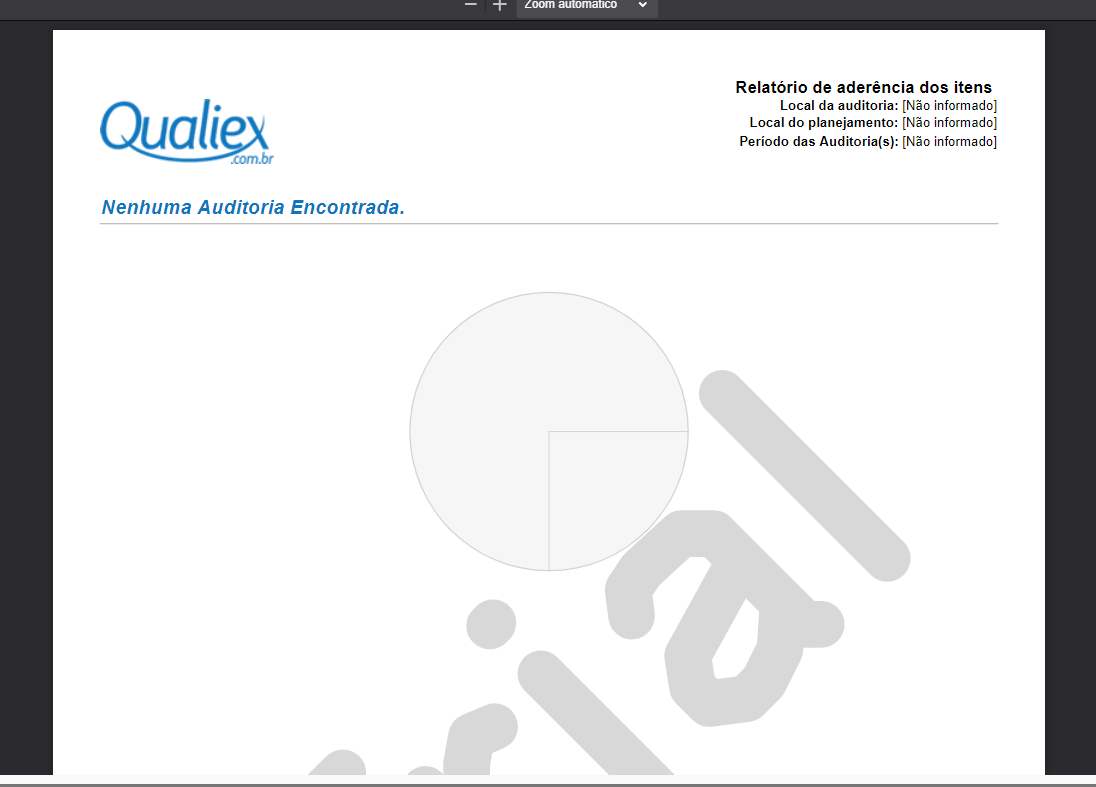
So, first of all: we cannot update the API to 2024.x.x simply because our report doesn’t render after the update. As I said before, we cannot simulate the problem because we cannot debug the report, and as I said too, the data is being transported correctly, and proof of this is that after rollbacking the version to 2023.3.1 it works fine. No code was changed, only the API version and the .exe version. Everything suggests that there are some bugs in the 2024 version, as shown in the picture below:

Before update:
Screenshot 2024-01-22 161549.png
Screenshot 2024-01-22 161549.png (72.09 KiB) Viewed 4641 times
After update:
Screenshot 2024-01-22 161500.png
Screenshot 2024-01-22 161500.png (51.65 KiB) Viewed 4641 times
With further investigation, we noticed on our SQL profiler that the null values are being converted to empty strings, as shown below:
Screenshot 2024-01-22 162450.png
Screenshot 2024-01-22 162450.png (45.34 KiB) Viewed 4641 times
Screenshot 2024-01-22 162502.png
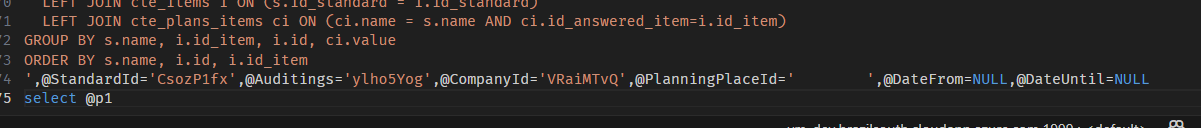
Screenshot 2024-01-22 162502.png (32.21 KiB) Viewed 4641 times

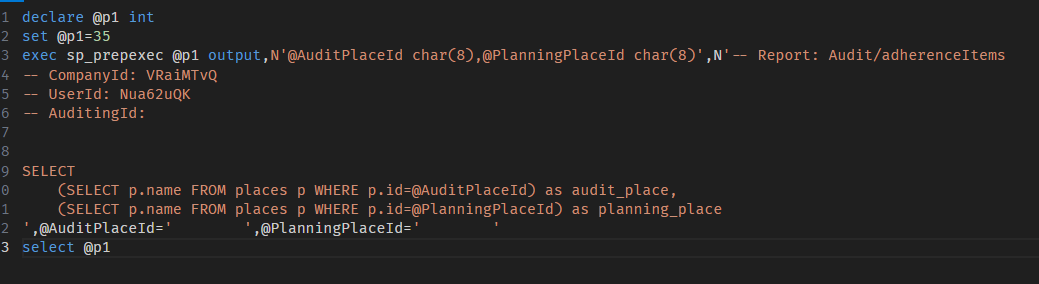
Thats our api parameters right before opening the report:
Screenshot 2024-01-22 165609.png
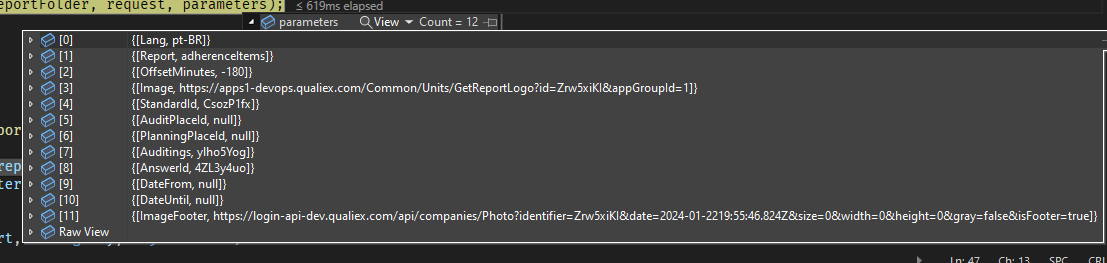
Screenshot 2024-01-22 165609.png (39.81 KiB) Viewed 4641 times
That our source code:

protected async Task<StiReport> GetReportAsync(string reportFolder, Dictionary<string, object> parameters)
{
string reportFile = parameters["Report"] + ".mrt";
string path = Path.Combine(AppDomain.CurrentDomain.BaseDirectory, "ReportTemplates", reportFolder, reportFile);

Stimulsoft.Drawing.Graphics.GraphicsEngine = Stimulsoft.Drawing.GraphicsEngine.ImageSharp;
var report = StiReport.CreateNewReport();
report.Load(path);
report.Culture = GetCulture(parameters);
if (parameters.ContainsKey("Lang"))
parameters["Lang"] = report.Culture;

var request = GetRequestData();
AddReportParameter(report, "CompanyId", request.CompanyId);
AddReportParameter(report, "UserId", request.UserId);
foreach (var (key, value) in parameters)
{
AddReportParameter(report, key, value);
report[key] = value;
}

AddCommentsToSqlCommands(report, reportFolder, request, parameters);
SetConnectionStrings(report);
await SetLogo(report, parameters);
report.Dictionary.Synchronize();
return report;
}

I tried to update to 2024.1.3 and still got the error.

So, we are stuck on this. We cannot even start to try to fix the chart colors because, now, the report doesn’t even render. Let's do one thing each. Let’s try to fix this data transport issue.
How can we move forward to find this bug? Is it a bug? Is it a new feature that converts strings to empty spaces? I really don’t know how to proceed.
I guess one of the possible solutions is to schedule a call so we can check this together.

Re: How can I implement custom chart colors?

Posted: Tue Jan 23, 2024 2:34 pm
by Lech Kulikowski
Hello,

> How can we move forward to find this bug? Is it a bug? Is it a new feature that converts strings to empty spaces? I really don’t know how to proceed.

Could you prepare and send us a for analysis a very simple report and test query?
We couldn't reproduce the issue with our samples.

Thank you.

Re: How can I implement custom chart colors?

Posted: Tue Jan 23, 2024 7:44 pm
by lucasrinaldi
Can't you explain to me how could I do that?
I only used Stimulsoft integrated with an API, and I do not have experience using other data sources.