Page 1 of 1
draw own lines in chart
Posted: Wed Aug 01, 2012 8:31 am
by gunde99
Hello!
Is it possible to draw a short vertical line (not gridline) in a line-chart at a specific Y-value? I found a component StiVerticalLinePrimitive but how do I set it's Left and Top attributes dynamically, depending on the Y-value which I get from a datasource and the charts data. See below:
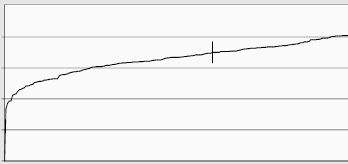
- chart.JPG (13.19 KiB) Viewed 3016 times
Re: draw own lines in chart
Posted: Wed Aug 01, 2012 12:01 pm
by HighAley
Hello.
gunde99 wrote:Is it possible to draw a short vertical line (not gridline) in a line-chart at a specific Y-value? I found a component StiVerticalLinePrimitive but how do I set it's Left and Top attributes dynamically, depending on the Y-value which I get from a datasource and the charts data.
Unfortunately, there is no such feature and StiVerticalLinePrimitive will not help you.
But you could use Constant Lines property of the chart. And set it's value from code or, for example, in before print event of the chart.
Thank you.
Re: draw own lines in chart
Posted: Thu Aug 02, 2012 6:18 am
by gunde99
Thank you for your reply. That looks great but I have two more questions.
1. Is the constans line always called "Item3"? If not, how can I find the name in my charts?
2. This is all well if I know the X-axis-value but in my case I know the Y-axis-value. Could you please post a script example on how to extract the corresponding X-value from the chart's datasource?
Re: draw own lines in chart
Posted: Thu Aug 02, 2012 9:12 am
by HighAley
Hello.
gunde99 wrote:1. Is the constans line always called "Item3"? If not, how can I find the name in my charts?
If you add constant line in Designer and it's name is Item3 then this name will be the same and you could use it.
gunde99 wrote:2. This is all well if I know the X-axis-value but in my case I know the Y-axis-value. Could you please post a script example on how to extract the corresponding X-value from the chart's datasource?
It's impossible to get value from the chart. You could get it from Data Source if you know y-axis-value.
Thank you.
Re: draw own lines in chart
Posted: Thu Aug 02, 2012 11:05 am
by gunde99
If you add constant line in Designer and it's name is Item3 then this name will be the same and you could use it.
That's my problem. I can't find any name-property and I don't see the name anywhere else in the designer.
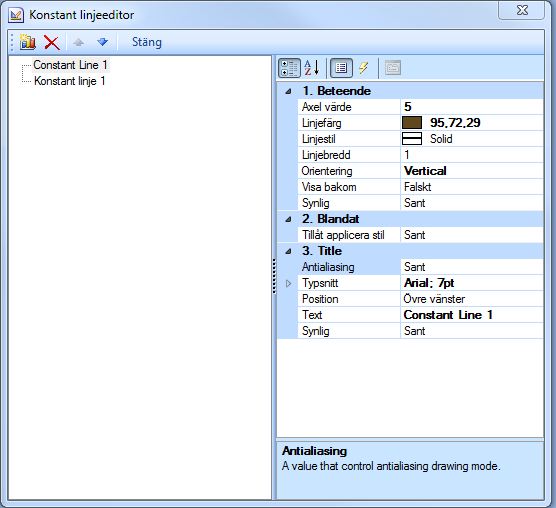
- chart2.JPG (46.96 KiB) Viewed 2998 times
Re: draw own lines in chart
Posted: Thu Aug 02, 2012 11:30 am
by HighAley
Hello.
But you could find it in the code tab.
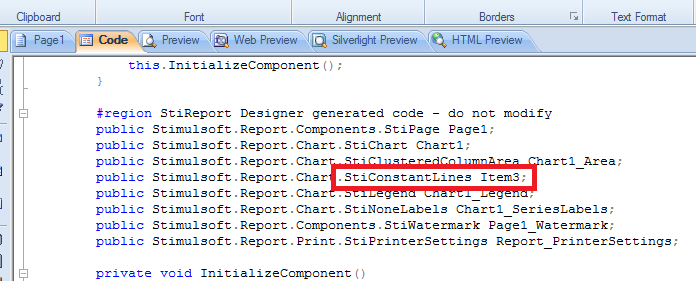
- ConstantLineName.png (25.77 KiB) Viewed 2997 times
Thank you.
Re: draw own lines in chart
Posted: Thu Aug 02, 2012 12:15 pm
by gunde99
My code looks empty:
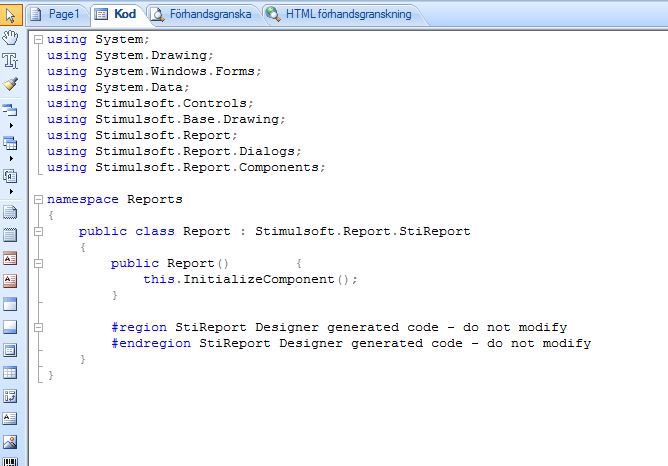
- (the report.mrt-file you gave me)
- chart3.JPG (54.14 KiB) Viewed 2995 times
Am I missing something?
Re: draw own lines in chart
Posted: Thu Aug 02, 2012 1:03 pm
by HighAley
Hello.
You should enable showing of the Auto Generated code.
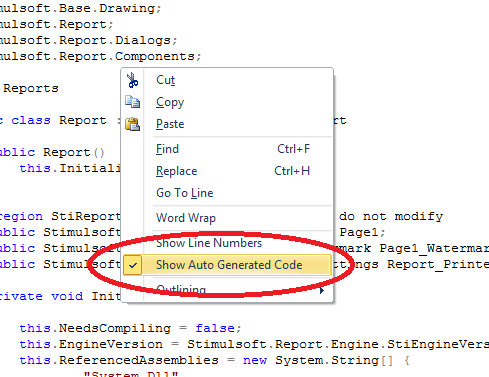
- AutoGeneratedCode.png (21.34 KiB) Viewed 2992 times
Thank you.
Re: draw own lines in chart
Posted: Thu Aug 02, 2012 1:15 pm
by gunde99
Ah, there it is! Thank you!
Re: draw own lines in chart
Posted: Fri Aug 03, 2012 7:31 am
by HighAley
Hello.
We are always glad to help you.
Let us know if you'll need any additional help.
Thank you.