Page 1 of 2
Chart
Posted: Fri Feb 28, 2014 10:16 am
by aline
EDIT: I've managed to draw the constant line through the BeginRender event of the report. However, just for the Left Y axis.
I also need to show lines based on the right Y axis. I've tried following the path through chart.area byt there is no Y right axis like in the designer. How can I do this?
Hi!
I need to show a chart in my report.
That chart needs to have Axis titles that I pass on a business object. But the property only seems to accept constant values. Is there another way to do this ? Maybe by code? How?
I also need to draw constant lines, but I need to change the value each time I cal the report. Again, in the designer I can only introduce constant values. Is there a workaround in the designer or by code?
Thanks,
Aline
Re: Chart
Posted: Mon Mar 03, 2014 8:13 am
by HighAley
Hello.
You could use next code to change titles before report rendering:
Code: Select all
var chart = report.GetComponentByName("Chart1");
(((Stimulsoft.Report.Chart.StiAxis)(((Stimulsoft.Report.Chart.StiAxisArea)((chart as StiChart).Area)).XAxis)).Title).Text = "YourXAxisTitle";
(((Stimulsoft.Report.Chart.StiAxis)(((Stimulsoft.Report.Chart.StiAxisArea)((chart as StiChart).Area)).YAxis)).Title).Text = "YourYAxisTitle";
(((Stimulsoft.Report.Chart.StiAxis)(((Stimulsoft.Report.Chart.StiAxisArea)((chart as StiChart).Area)).YRightAxis)).Title).Text = "YourRightYAxisTitle";
Thank you.
Re: Chart
Posted: Mon Mar 03, 2014 9:15 am
by aline
Hi!
Thank you for your answer. Have you noticed me edit to the post?
EDIT: I've managed to draw the constant line through the BeginRender event of the report. However, just for the Left Y axis.
I also need to show lines based on the right Y axis. I've tried following the path through chart.area byt there is no Y right axis like in the designer. How can I do this?
Can you help with the constant line based on the right Y axis values?
Thank you
Aline
Re: Chart
Posted: Mon Mar 03, 2014 10:46 am
by HighAley
Hello.
Unfortunately, it's impossible now.
If you need this feature, please, send a request to
support@stimulost.com
Thank you.
Re: Chart
Posted: Mon Mar 03, 2014 12:04 pm
by aline
Hello again!
I will send the request, for that's an importante issue for us.
Thank you
Aline
Re: Chart
Posted: Mon Mar 03, 2014 12:49 pm
by HighAley
Hello, Aline.
We will discus this feature with our team-leader and will let you know about results.
Thank you.
Re: Chart
Posted: Mon Mar 03, 2014 12:57 pm
by aline
Thank you, Aleksey!
Re: Chart
Posted: Tue Mar 04, 2014 11:03 am
by HighAley
We will answer you message soon.
Thank you.
Re: Chart
Posted: Tue Mar 04, 2014 3:02 pm
by aline
Hi there!
I've tried the code you suggested to change the axis titles:
You could use next code to change titles before report rendering:
Code: Select all
var chart = report.GetComponentByName("Chart1");
(((Stimulsoft.Report.Chart.StiAxis)(((Stimulsoft.Report.Chart.StiAxisArea)((chart as StiChart).Area)).XAxis)).Title).Text = "YourXAxisTitle";
(((Stimulsoft.Report.Chart.StiAxis)(((Stimulsoft.Report.Chart.StiAxisArea)((chart as StiChart).Area)).YAxis)).Title).Text = "YourYAxisTitle";
(((Stimulsoft.Report.Chart.StiAxis)(((Stimulsoft.Report.Chart.StiAxisArea)((chart as StiChart).Area)).YRightAxis)).Title).Text = "YourRightYAxisTitle";
But I can only get it to work for the X axis.
I'm sending you a sample.
Thanks
Aline
Re: Chart
Posted: Thu Mar 06, 2014 12:22 pm
by HighAley
Hello.
We have checked your project. It works right.
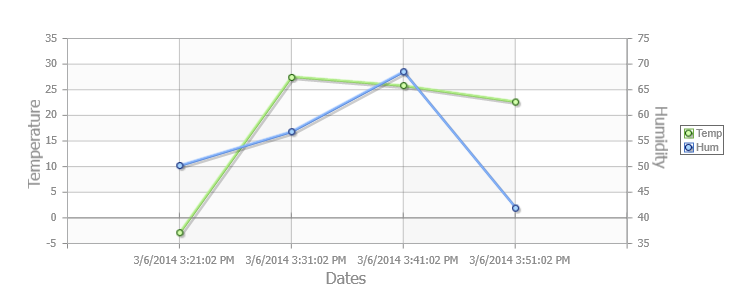
- ChartAxis.png (27.37 KiB) Viewed 10773 times
Thank you.