Page 1 of 1
Report from Cross Table
Posted: Fri May 09, 2014 9:10 am
by mkeuschn
Hello *,
I want to create a chart with the data of a cross table. How can I accomplish this task. I have attached a excel how the chart should look like and the report file.
best regards,
Marko
Re: Report from Cross Table
Posted: Mon May 12, 2014 10:02 am
by mkeuschn
Hello,
I have found a solution. I have created a new data source from cross tab. But the Chart does not look like as expected.
regards,
Marko
Output:
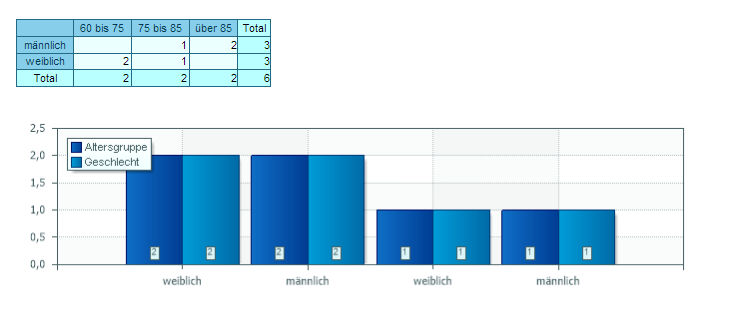
- Crosstab.png (19.5 KiB) Viewed 1967 times
Expected Output:
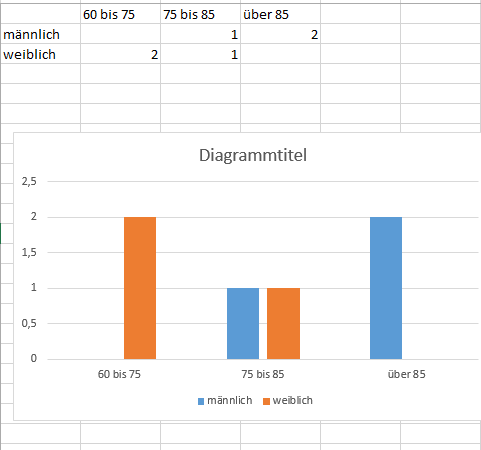
- CrosstabSolution.png (10.06 KiB) Viewed 1967 times
Re: Report from Cross Table
Posted: Mon May 12, 2014 10:36 am
by Alex K.
Hello,
Can you please send us a test data for your report.
Thank you.
Re: Report from Cross Table
Posted: Tue May 13, 2014 4:49 am
by mkeuschn
Hi,
I have added a Test Project.
regards,
Marko
Actual Output
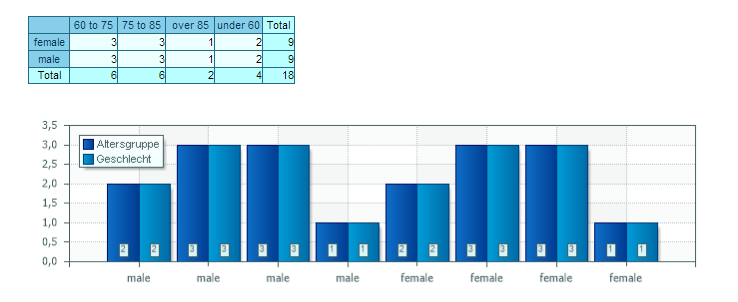
- ActualOutput.png (26.17 KiB) Viewed 1964 times
Desired Output
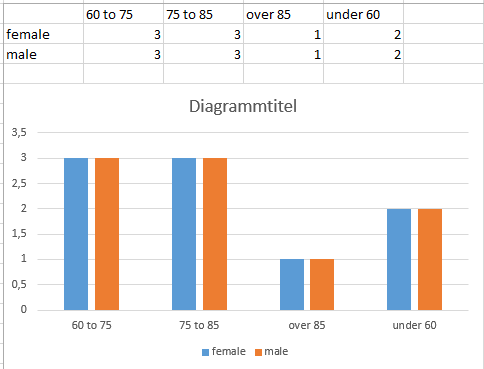
- DesiredOutput.png (11.24 KiB) Viewed 1964 times
Re: Report from Cross Table
Posted: Wed May 14, 2014 1:39 pm
by mkeuschn
I have a solution. I have set the key attribute in the chart.
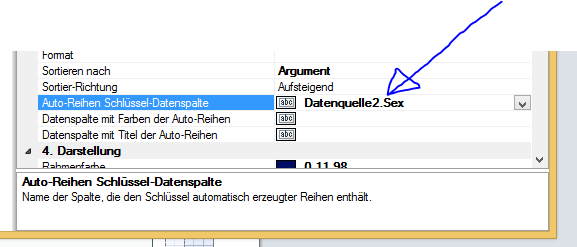
- Key.png (13.04 KiB) Viewed 1953 times
One Problem remaining:
In the first CrossTable the Total Count is wrong. It does not sum the "count values", but it sum the "sum values".
regards,
Marko
Re: Report from Cross Table
Posted: Fri May 16, 2014 11:33 am
by HighAley
Hello, Marko.
The Chart looks right. Do you Need other values?
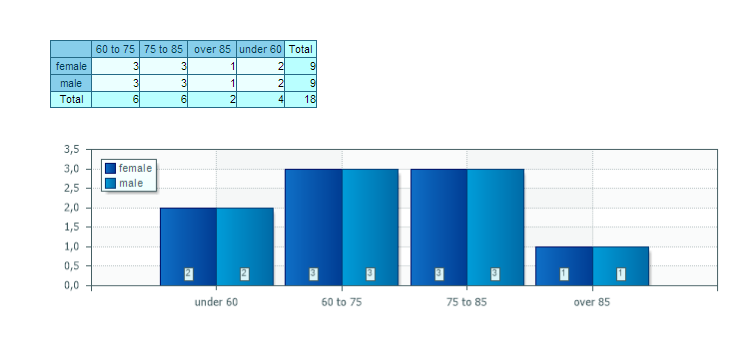
- chart.png (20.05 KiB) Viewed 1947 times
Please, write what is wrong with this chart?
Thank you.