Page 1 of 1
Gantt graph date range
Posted: Mon Aug 17, 2015 3:19 pm
by StixStax
For some reason I allways get a date range starting form 12.1899 (x-axis), although all values of the date coulmn start in 2015.I tested all values on a databand and couldn't find a date in 1899. Is there a way to fix this issue? I uploaded a screenshot of the graph.
Re: Gantt graph date range
Posted: Tue Aug 18, 2015 5:40 am
by HighAley
Hello.
Sorry, but we couldn't reproduce your issue.
Could you specify what version you use?
Please, try to set the Start From Zero property of the X Axis to False.
Thank you.
Re: Gantt graph date range
Posted: Tue Aug 18, 2015 11:39 am
by StixStax
Thank for replying so fast Aleksey. I can't find the property Start from Zero. Would you mind posting a screenshot?
Re: Gantt graph date range
Posted: Tue Aug 18, 2015 12:24 pm
by HighAley
Hello.
You could find this property on the attached image.
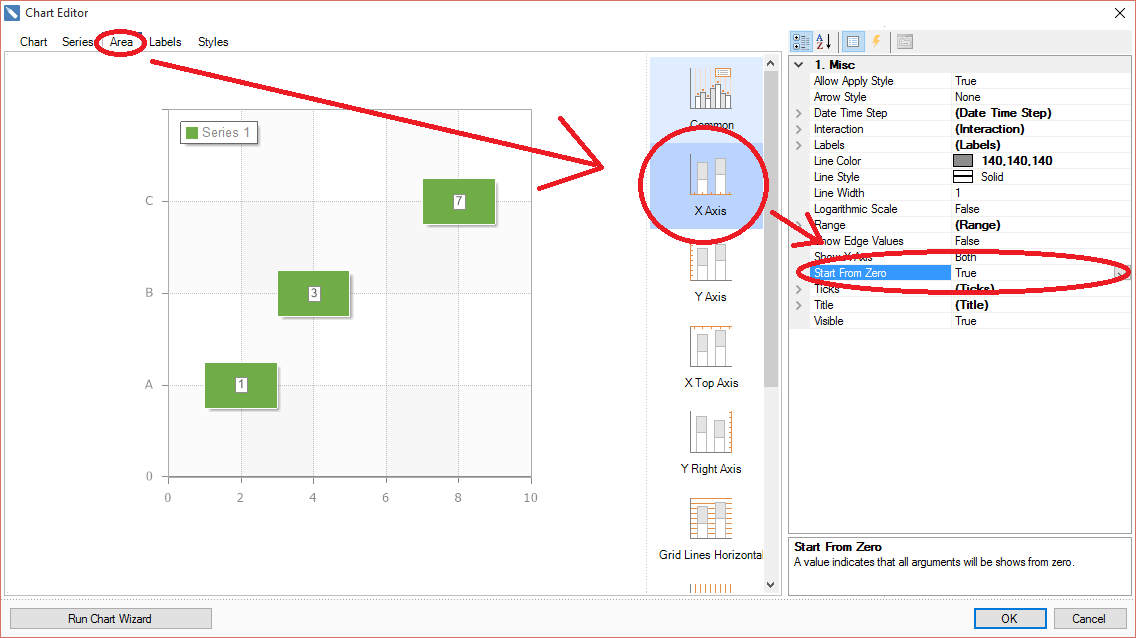
- StartFromZero.png (36.22 KiB) Viewed 3262 times
Thank you.
Re: Gantt graph date range
Posted: Tue Aug 18, 2015 12:35 pm
by StixStax
Perfect. Solved my issue. Thanks so much
Re: Gantt graph date range
Posted: Tue Aug 18, 2015 3:18 pm
by StixStax
I'm trying to show the work hours for one day (24 h), but StimulSoft somehow automatically sets the range for 10 days. I'm using Version 2012.1.1300 (3rd April 2012). In your previous post I saw that in the new Stimulsoft Version you can set a Date Time step. Is this also possible in my version ?
Re: Gantt graph date range
Posted: Wed Aug 19, 2015 6:51 am
by HighAley
Hello.
StixStax wrote:In your previous post I saw that in the new Stimulsoft Version you can set a Date Time step. Is this also possible in my version ?
Unfortunately, this feature was added much later.
Please, try our latest release.
Thank you.