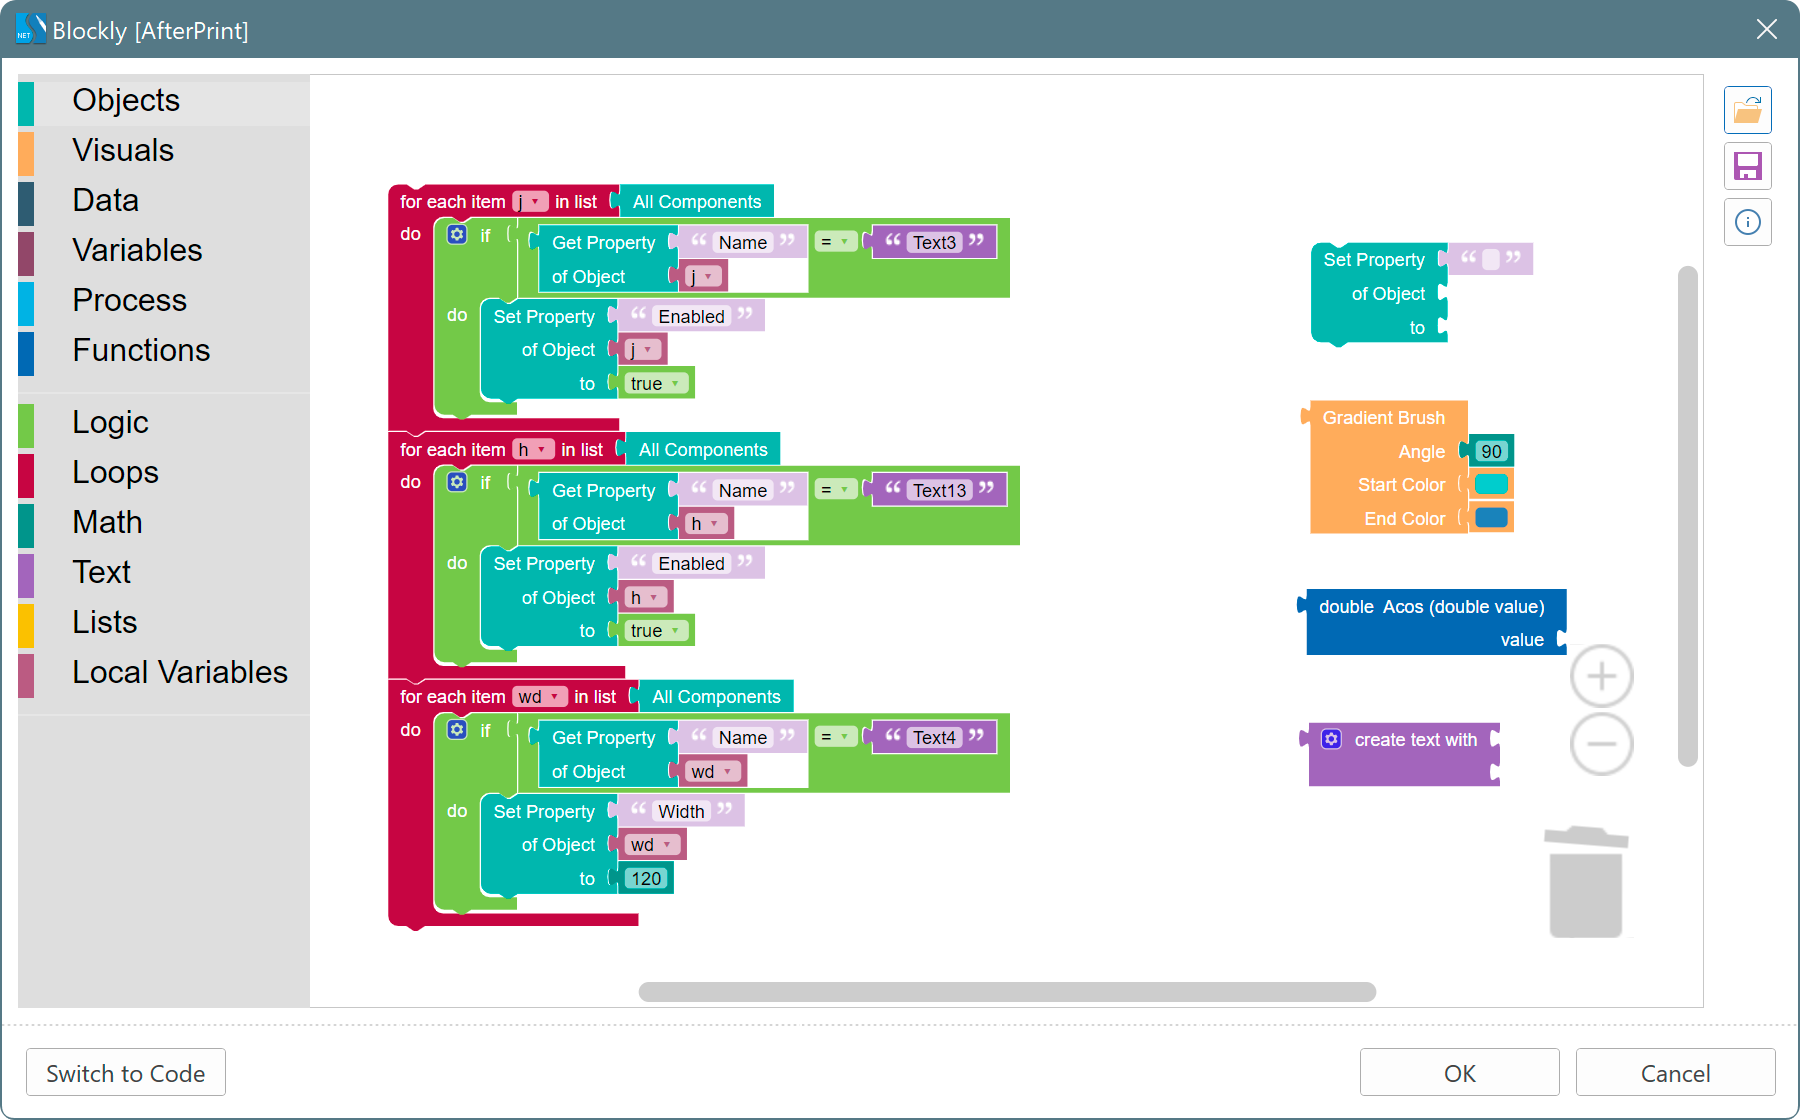
Blockly
We integrated the Blockly library to create event scripts in reports. With this tool, you can create various scripts visually without writing any code. The event script created with Blockly will be universal for all report writers. Accordingly, your report will work both in the WinForms report designer and in the JS report designer. The list of supported report component events may vary.
Framework Versions on Publish
In the Publish wizard, you may select the type and version of the framework for ASP.NET MVC, WinForms, and WPF platforms. .NET Framework 4.5.2, .NET Core 3.1, .NET 5.0 frameworks are available. This will reduce the time it takes to integrate Stimulsoft components into your application.
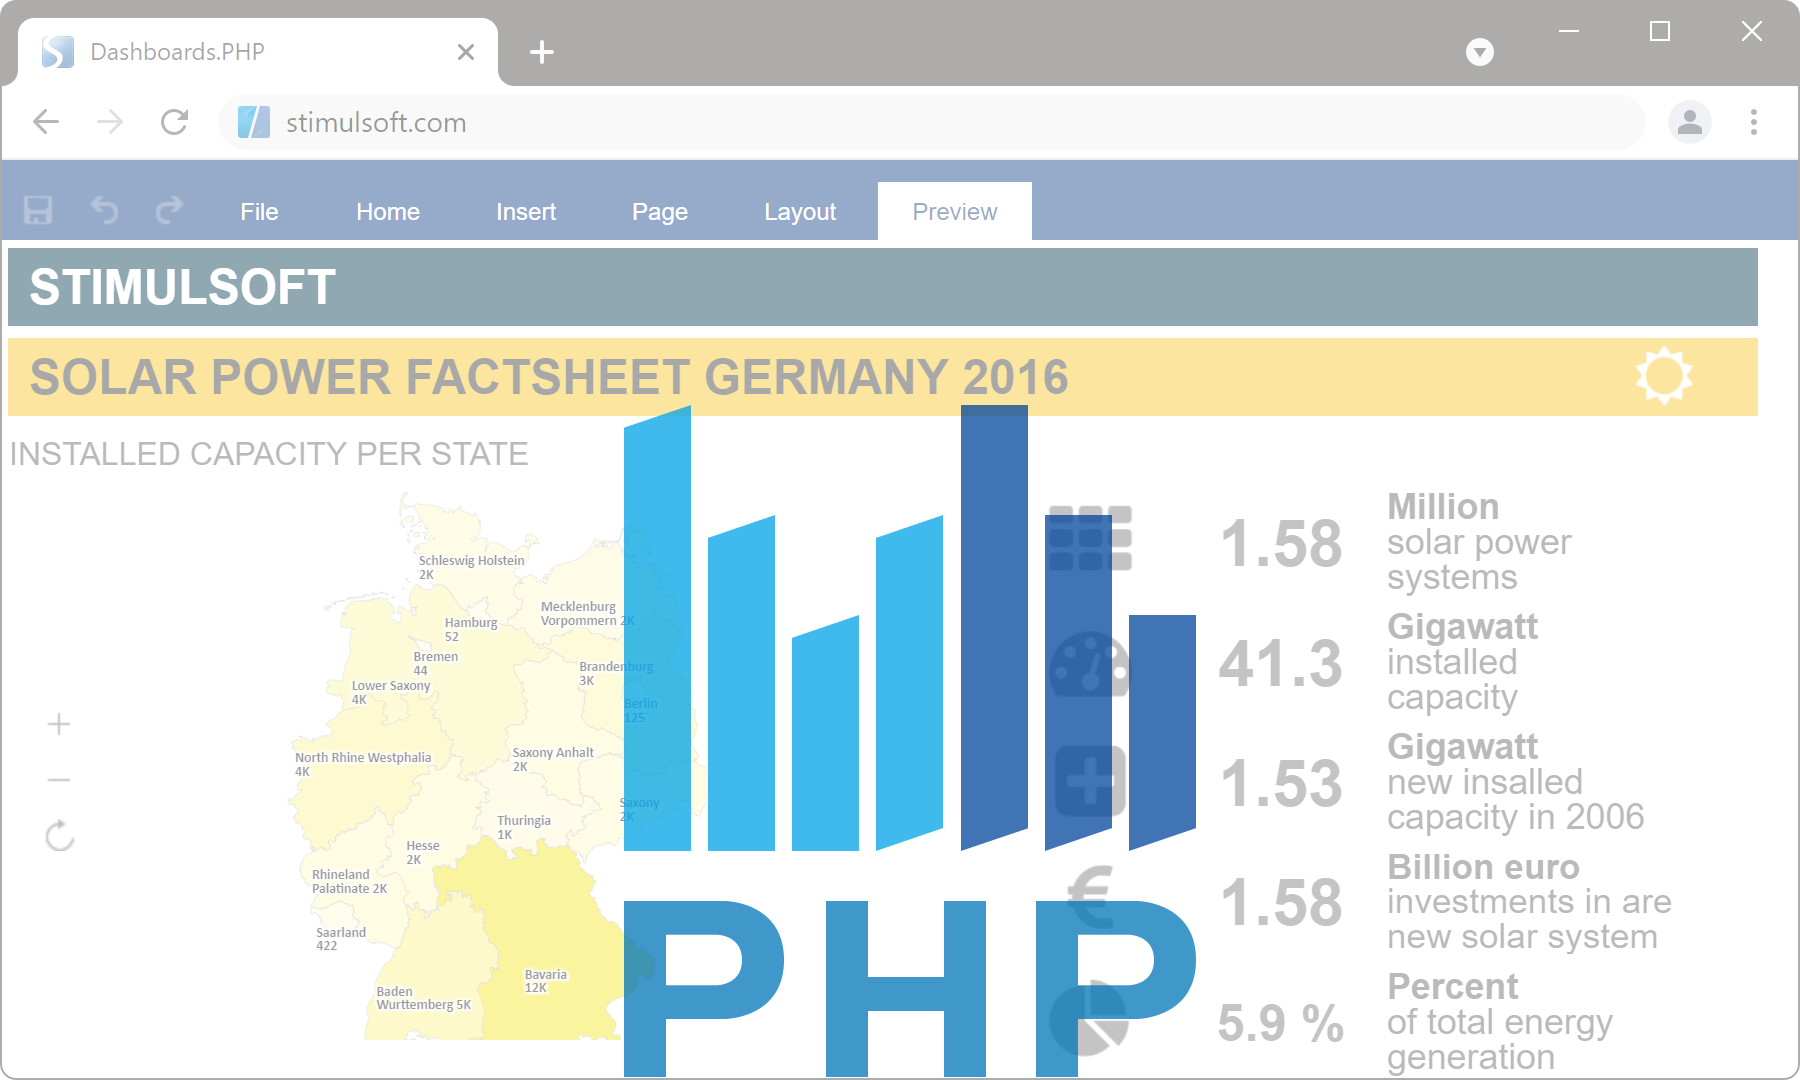
Stimulsoft Dashboards.PHP
We are launching a new product - Dashboards.PHP, based on the JavaScript data analysis engine. All necessary scripts, detailed guidelines, and integration samples are available for you. Take advantage of this right now to quickly and efficiently achieve your analytical goals in your PHP project.
Scheduler
We added the Scheduler tool to automate the reporting process in Stimulsoft Designer. With this tool, you can convert the report and dashboard into a finished document and send them by email according to a specific schedule. Hourly, daily, weekly, monthly, yearly schedulers are available with many options for flexible scheduling.
Manual data entry
For dashboard elements such as Chart, Indicator, Progress, Gauge, we added the functionality to enter data manually. You may switch to manual input mode in the editors of these elements. Value entry fields are cells that are linked line by line. The number of rows is unlimited, and in cells, in addition to values, you can also specify expressions.
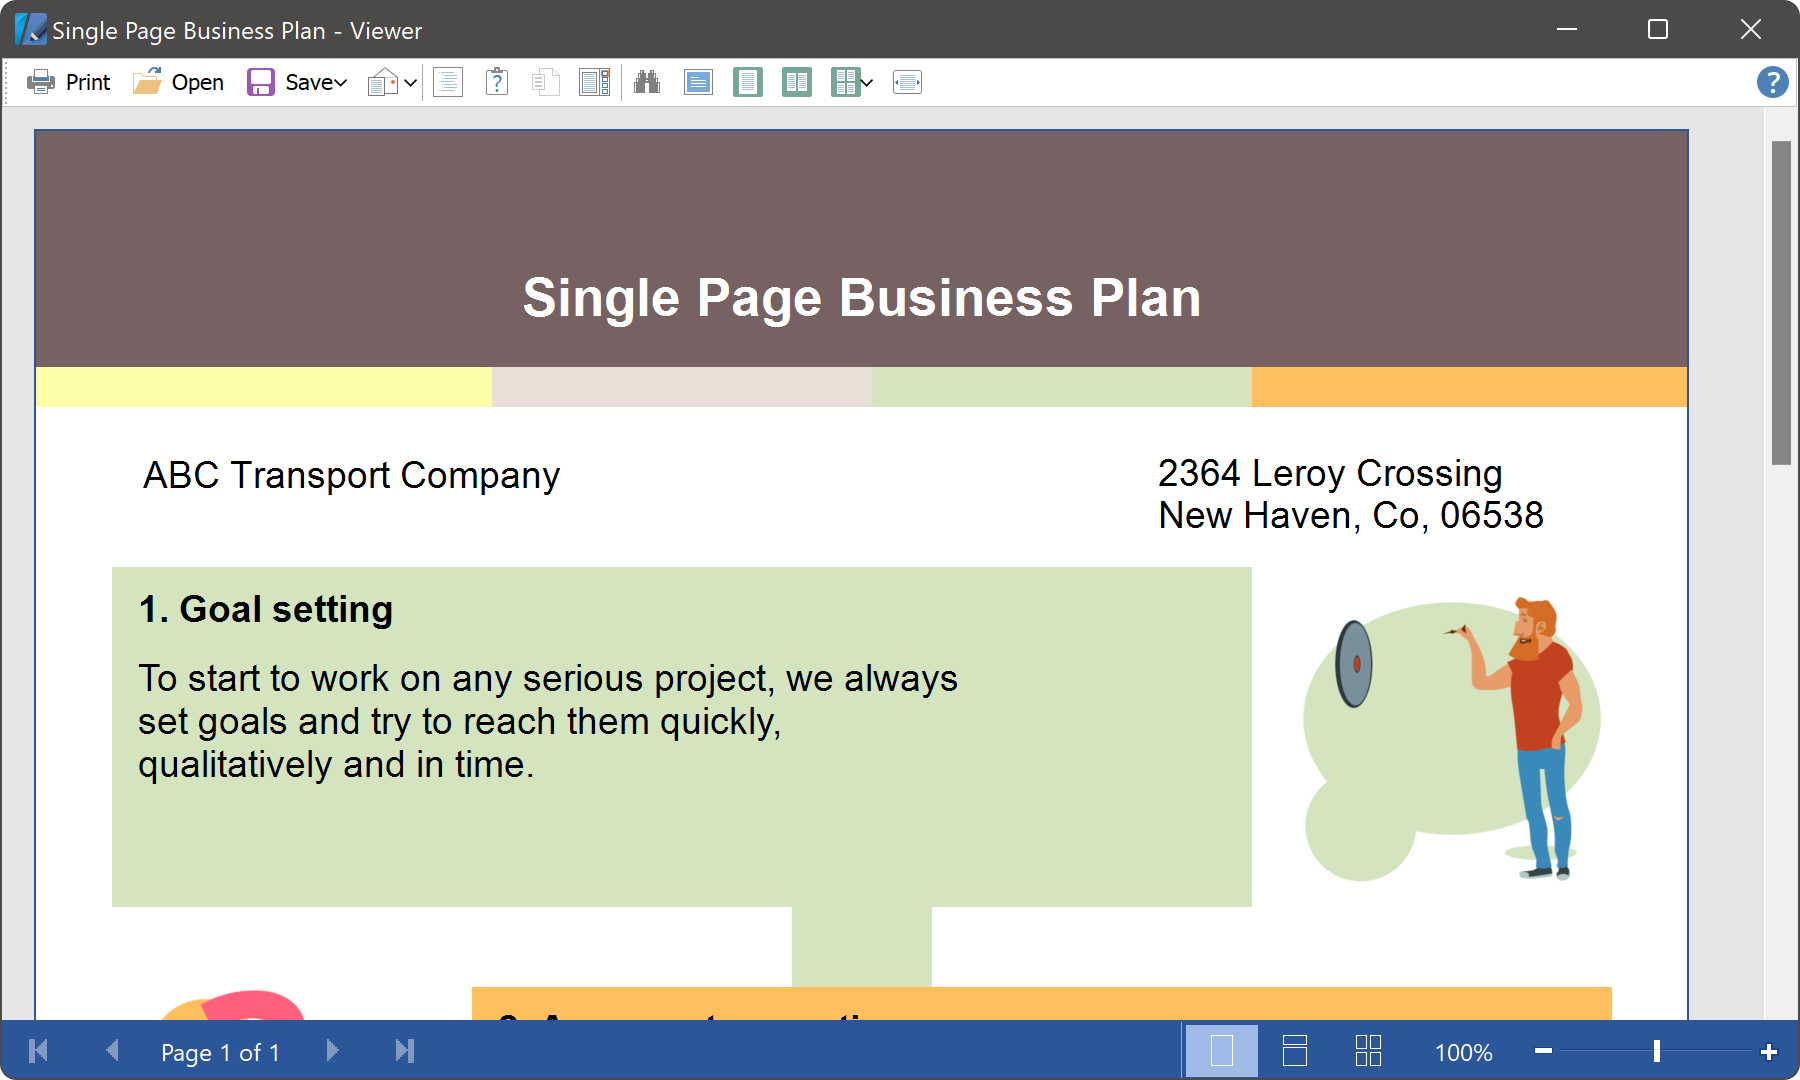
Exceed margins
We added the functionality for the Text Box component to fill the page space outside the print margins with the background color of this component. The Exceed Margins property is used for this. Depending on the selected direction, the background color of the text component will fill the page space beyond the print margins, up to the page margins.
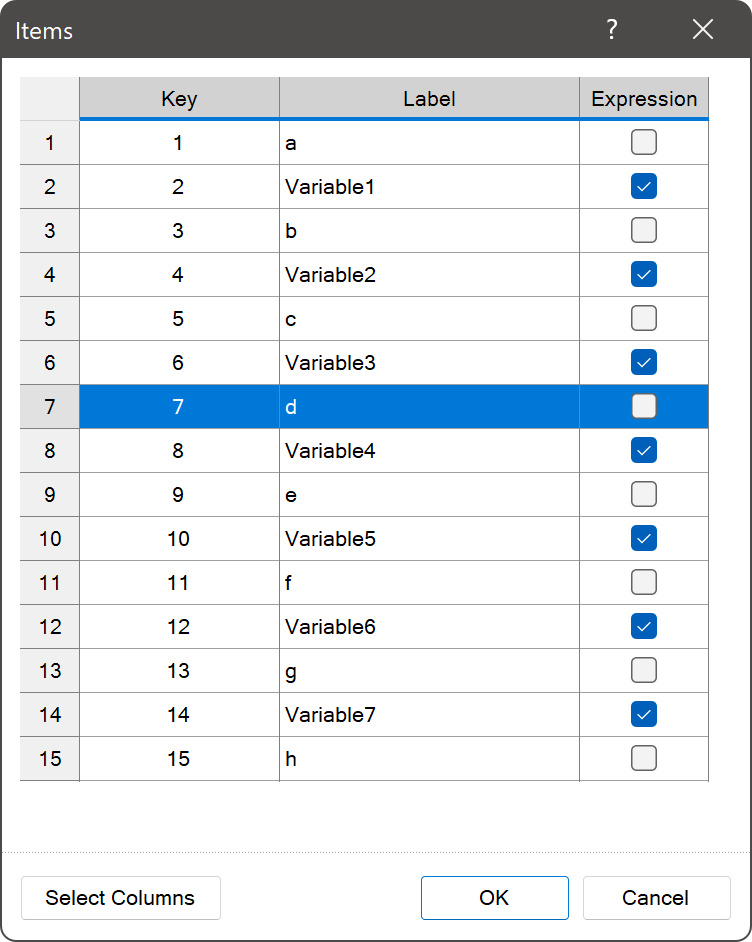
New element editor in a variable
We improved the element editor in a variable. Now the input fields for elements are presented as a dimensionless grid in the cells of which you can specify both simple values and expressions.
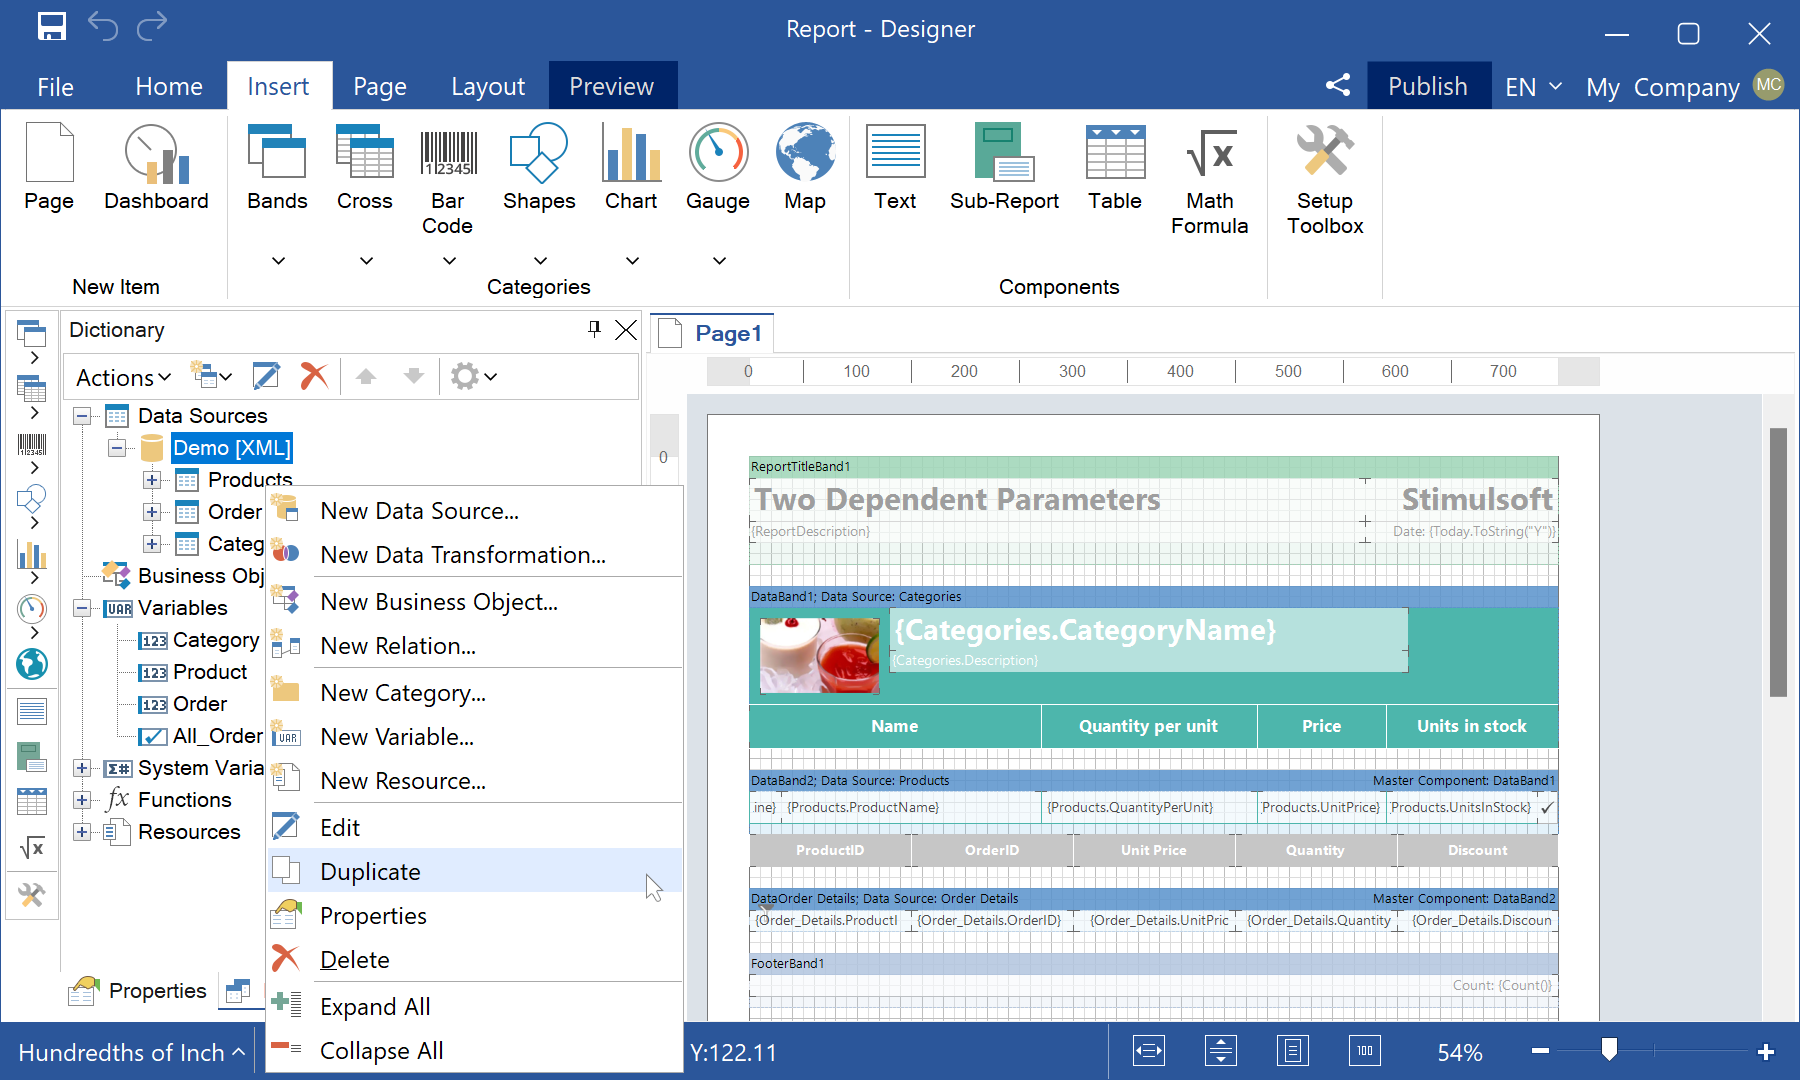
Cloning in a dictionary
We simplified the ability to clone items in the data dictionary. Using the Duplicate command on the context menu, you can quickly clone data sources, connections, variables, and other data dictionary elements.
Windows 11 support
Before releasing the new version of the Windows 11 operating system, we are glad to inform you that our tool is completely ready for the latest OS version. In addition, we have added a Windows 11 GUI theme to the WPF report designer.
Text in shapes
We added the ability to specify text inside shapes. This feature is available for most shapes - a text entry field located in the editor of the Shape component.