Page 1 of 1
Problem with Line chart when argument is datetime
Posted: Thu Apr 07, 2022 11:09 am
by m.hobanov
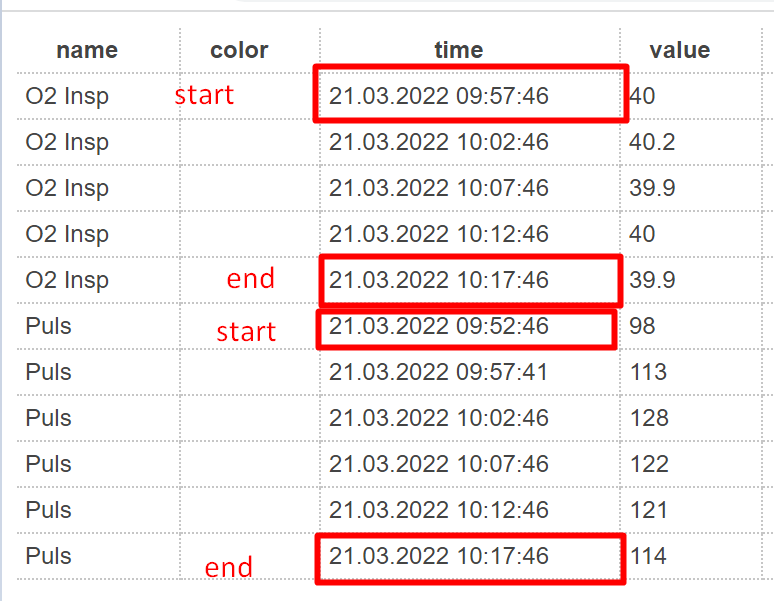
Hello, i have problem with line chart when set argument as datetime
My data
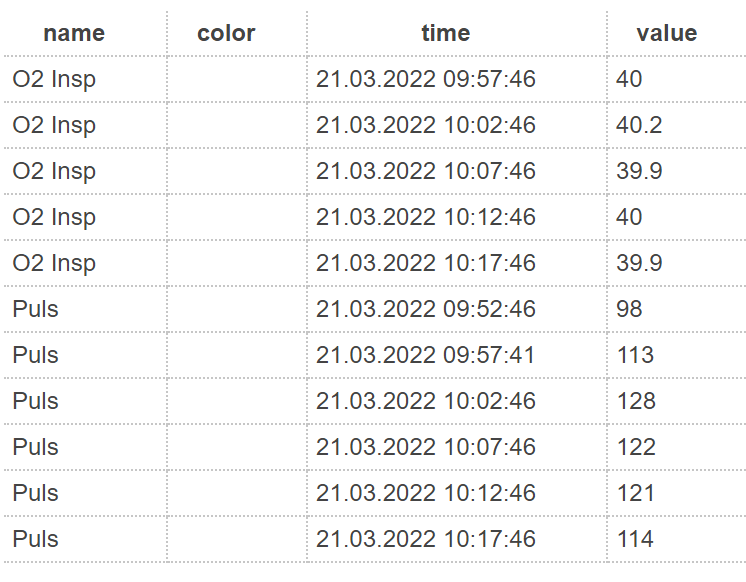
- Screenshot_1.png (42.27 KiB) Viewed 2307 times
how it display
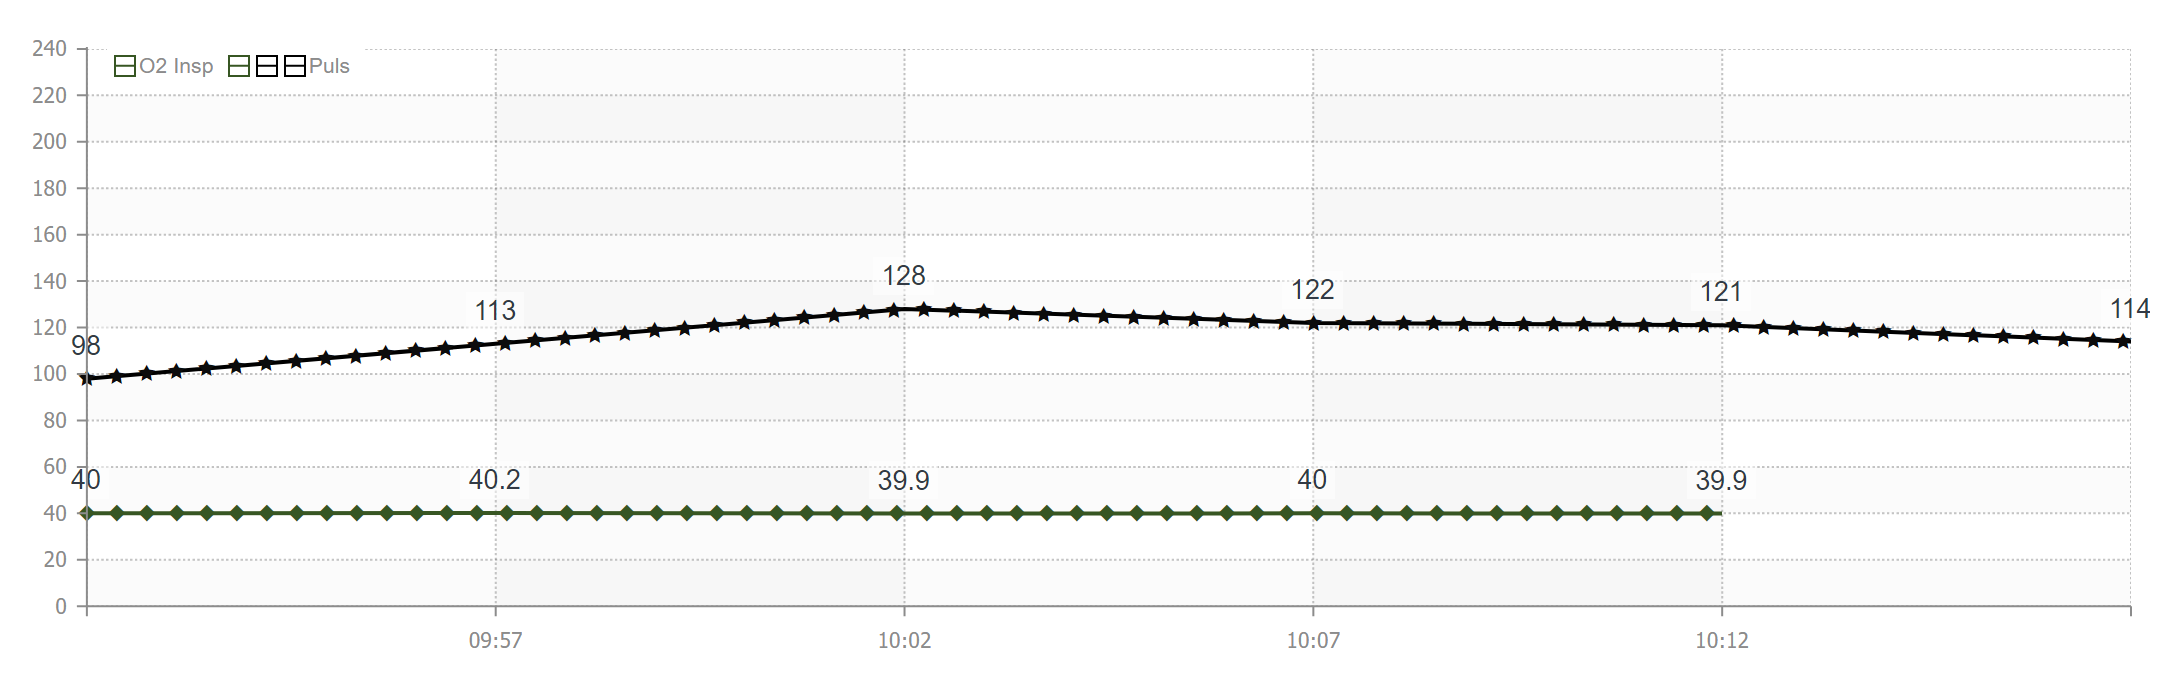
- Screenshot_2.png (77.26 KiB) Viewed 2307 times
how it must be display according to my data
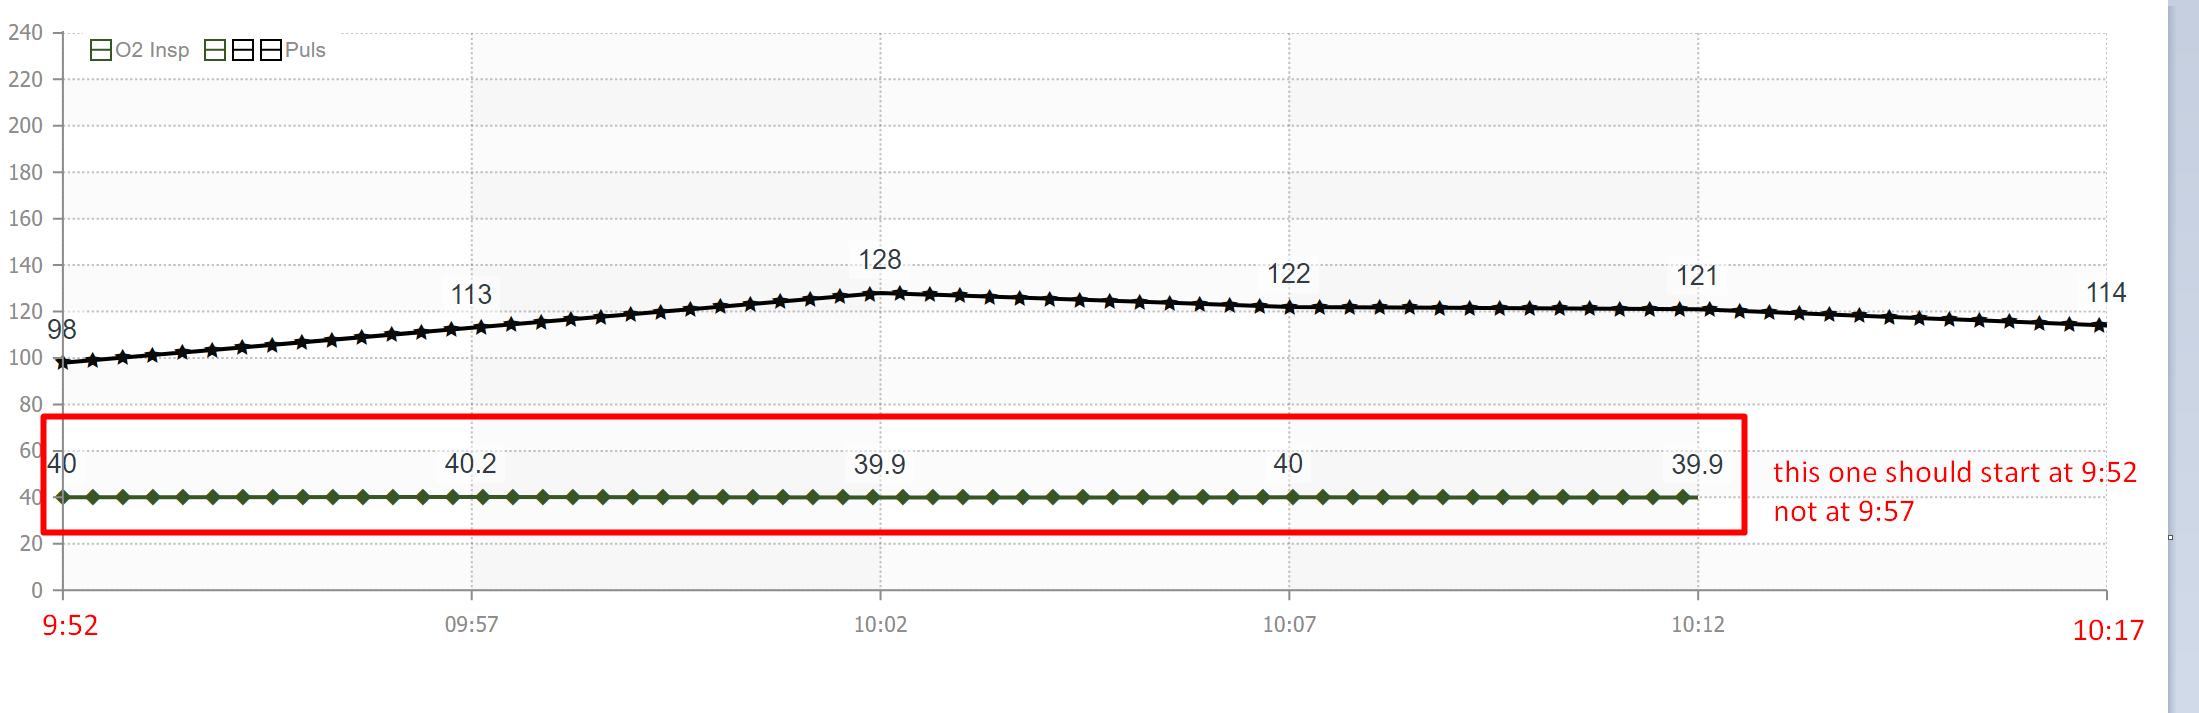
- Screenshot_3.png (84.5 KiB) Viewed 2307 times
Here's a mrt and json:
Can you please help me with this?
Re: Problem with Line chart when argument is datetime
Posted: Thu Apr 07, 2022 3:38 pm
by Max Shamanov
Hello,
You can use property "Show Edge Values"
Thank you.
Re: Problem with Line chart when argument is datetime
Posted: Fri Apr 08, 2022 8:00 am
by m.hobanov
the second chart must started at 9:57 not at 9:52
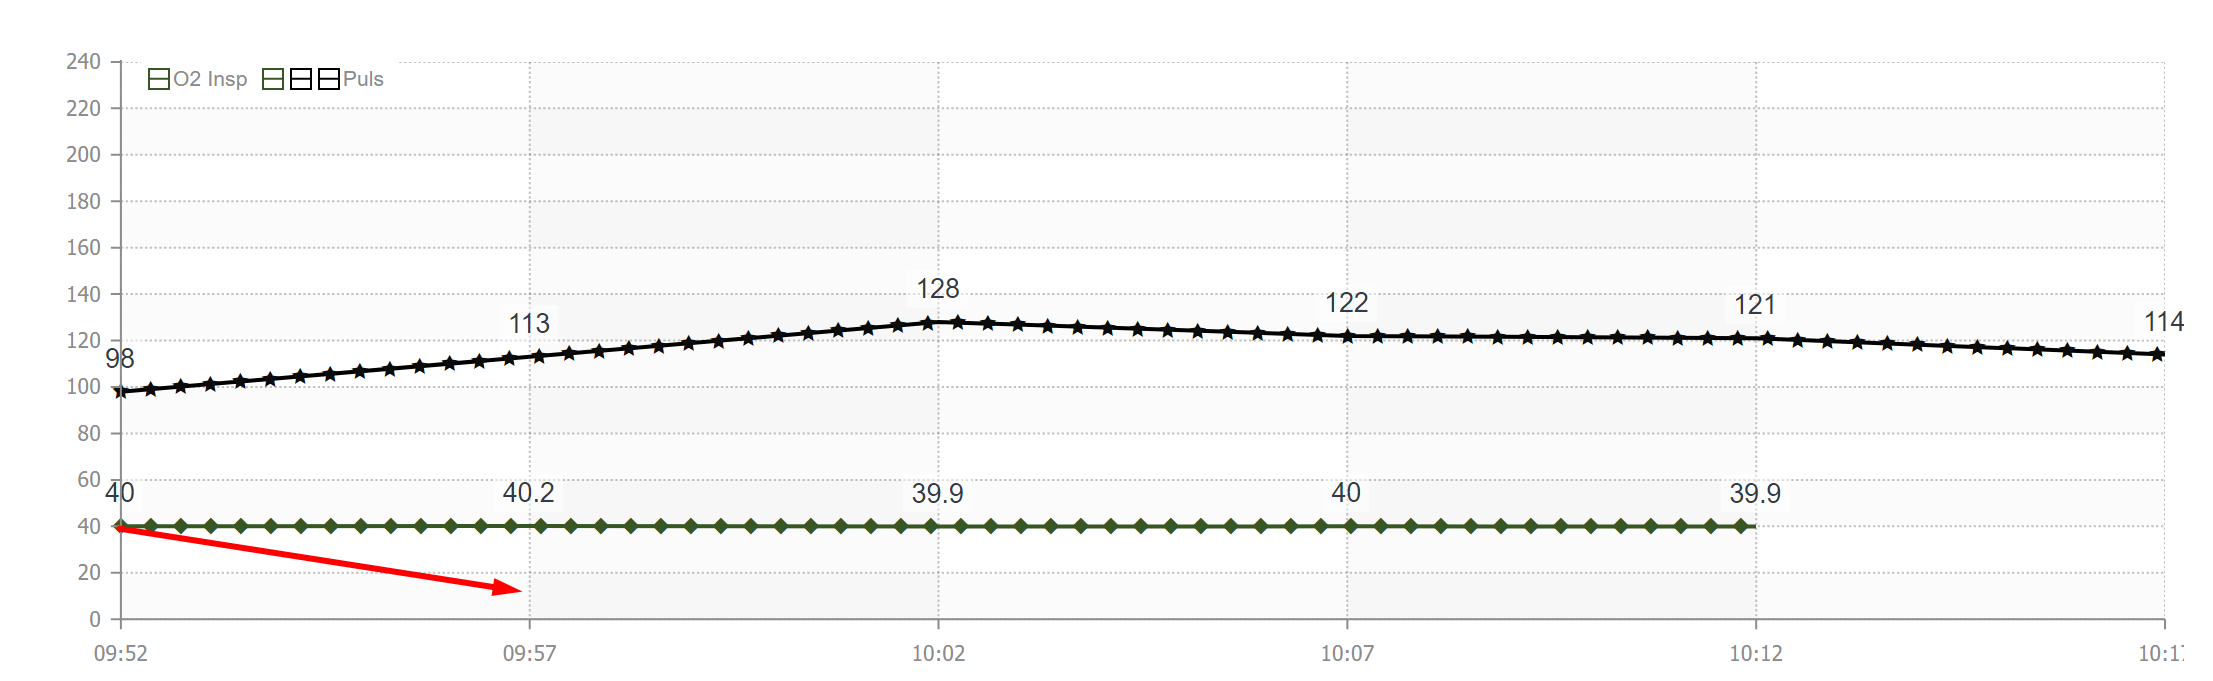
- Screenshot_4.png (81.15 KiB) Viewed 2285 times
- Screenshot_5.png (47.36 KiB) Viewed 2285 times
Re: Problem with Line chart when argument is datetime
Posted: Fri Apr 08, 2022 12:44 pm
by Max Shamanov
Hello,
We need some additional time to investigate the issue, we will let you know about the result.
Thank you.
#6670
Re: Problem with Line chart when argument is datetime
Posted: Wed Apr 13, 2022 5:32 pm
by m.hobanov
How its going with it, do you need additional info?
Re: Problem with Line chart when argument is datetime
Posted: Thu Apr 14, 2022 6:59 am
by Max Shamanov
Hello,
We are still working on that issue, we will let you know about the result.
Thank you.
#6670
Re: Problem with Line chart when argument is datetime
Posted: Thu Apr 21, 2022 1:25 pm
by m.hobanov
Any new info on this issue?
Re: Problem with Line chart when argument is datetime
Posted: Thu Apr 21, 2022 1:57 pm
by Max Shamanov
Hello,
We are still working on that issue, we will let you know about the result.
Thank you.
Re: Problem with Line chart when argument is datetime
Posted: Mon Apr 25, 2022 1:46 pm
by Max Shamanov
Hello,
Please check the attached report.
Thank you.