New product – Stimulsoft Dashboards.BLAZOR
We announce the release of a new product –Stimulsoft Dashboards.BLAZOR. This is a cross-platform solution of data analytics created to integrate the application that works using the Blazor framework. Our product works both on the server (Blazor Server) and client (Blazor WebAssembly) sides. You may quickly integrate it into any web project. It allows you to display and analyze information from many data sources and has a wide range of components to design dashboards. Also, we have added an ability to save a project with dashboards from the Publish wizard to quickly integrate Stimulsoft components into a Blazor application. This product is available with Stimulsoft Dashboards.WEB subscription.
New graphics library

We have created the Stimulsoft.Drawing – an independent interface of displaying graphical objects for .NET Core components with various versions of framework - .NET Standard 2.1, .NET Core 3.1, .NET 5.0, .NET 6.0. This library is also suitable for Blazor components. The GDI+ library is compatible with .NET Core components in the Windows operating system and libgdiplus - Mono Project in other OS. Very often, some difficulties could arise with displaying graphics. Using the Stimulsoft.Drawing library, the display of graphics in your application won’t depend on an operating system. This library is included in the NuGet package of Blazor and .NET Core components. At the same, we left the option to switch to using the system GDI+ library.
Compilation for Blazor

The support of the compilation mode to render reports when using the Blazor Server platform is added to the new version. Now you can use all features of the report generator – runtime compilation, functions, publishing reports as classes. Compilation is available on all supported operating systems.
GraphQL data adapter

Starting with the 2022.3 release, you can get data from various data stores using the GraphQL query model. This data source type has a number of advantages over REST or SQL queries. You should select the GraphQL point from the REST tab in the New Data Source window, specify the URL to a data store, and query text. After getting data, you can create them based on reports and dashboards.
Ribbon Chart
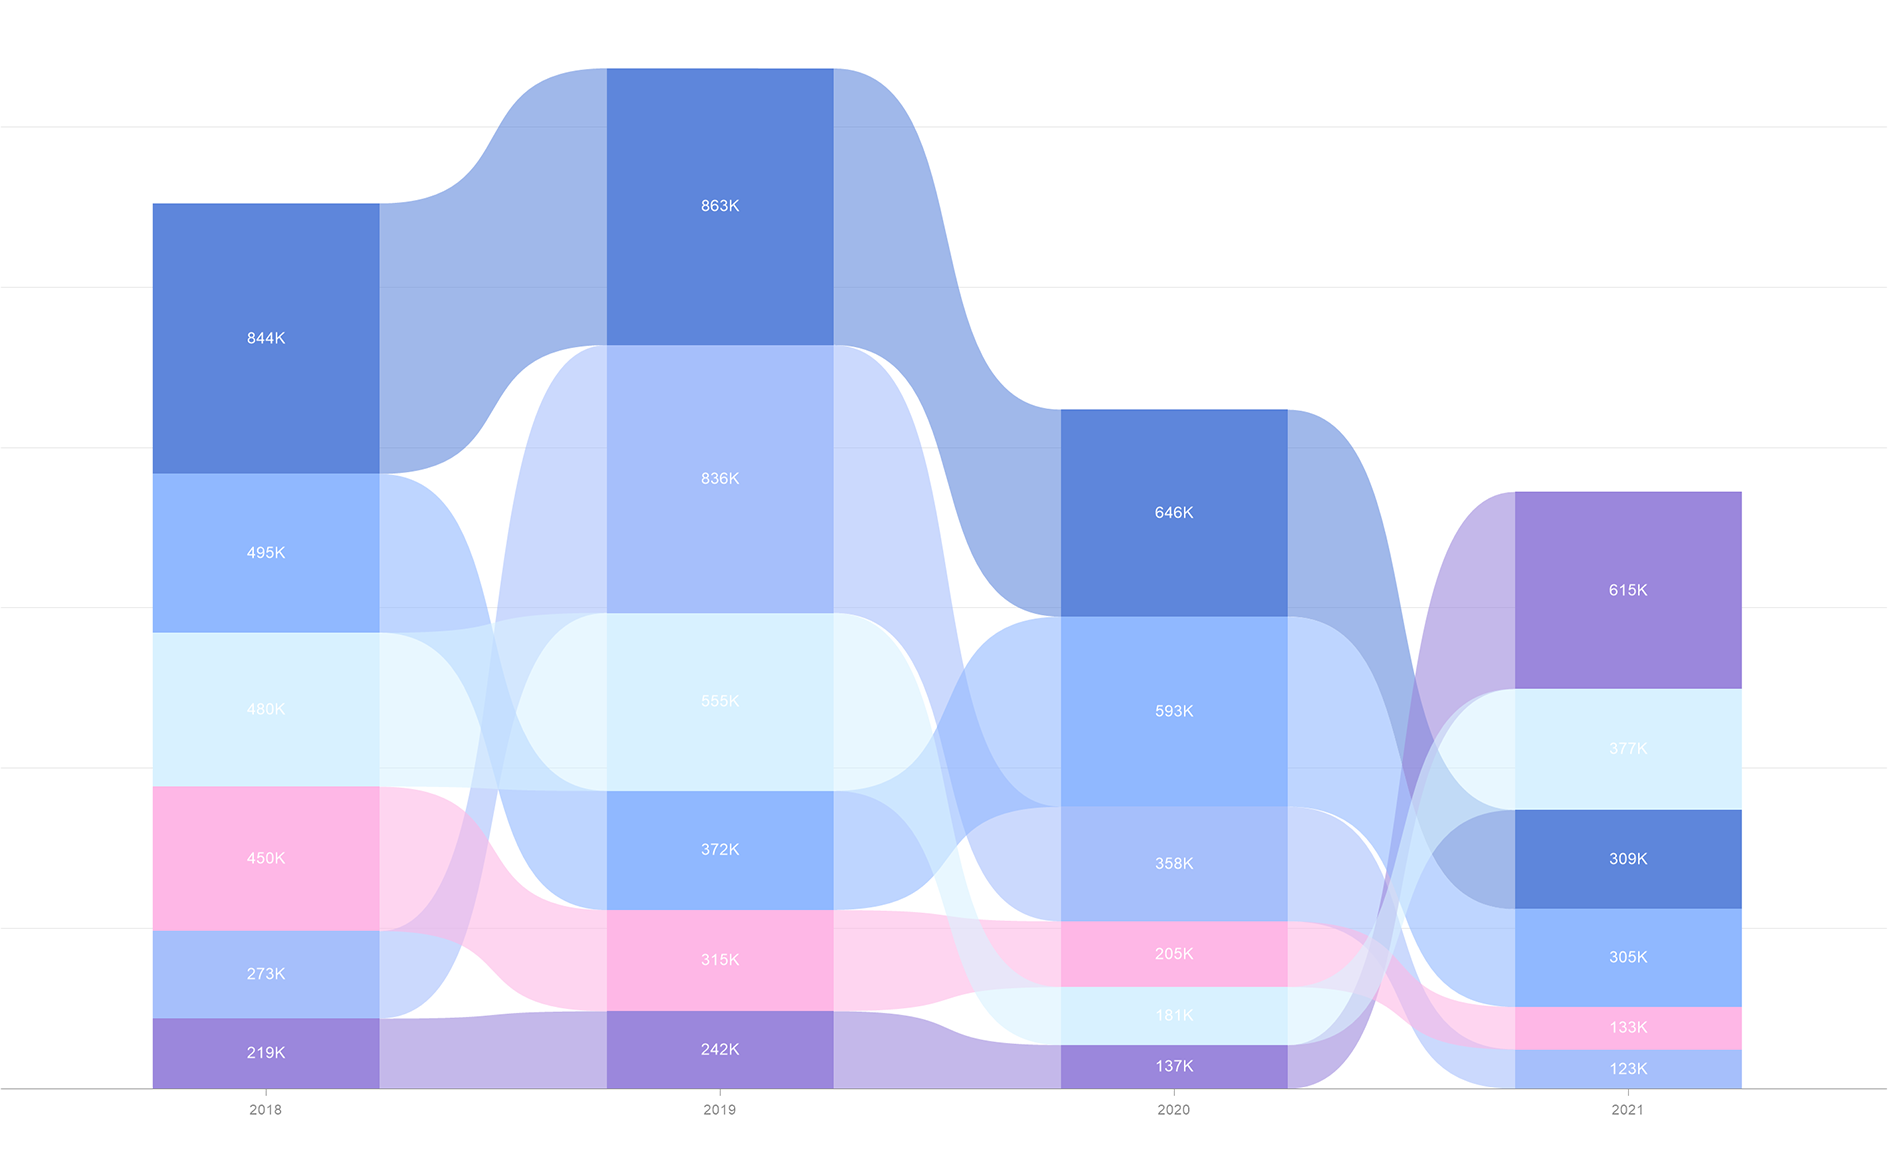
Another feature of the current release concerns the sphere of analysis and display of data - Ribbon Chart. This chart type is an improved version of the Stacked Column chart. First, values for each argument are sorted from largest to smallest, i.e., the maximum value is always displayed topmost. It considerably improves analysis and visual perception of the values of a particular argument. Second, a curve is drawn between the values of the arguments (this is a ribbon), which allows you to estimate the tendencies and trends of indicators when analyzing visually. Try it yourself. The chart is available in reports and dashboards, and you may find it in the Histogram category. In addition, we have added an ability to apply conditional formatting for the Range chart type.
New features for the Tooltip
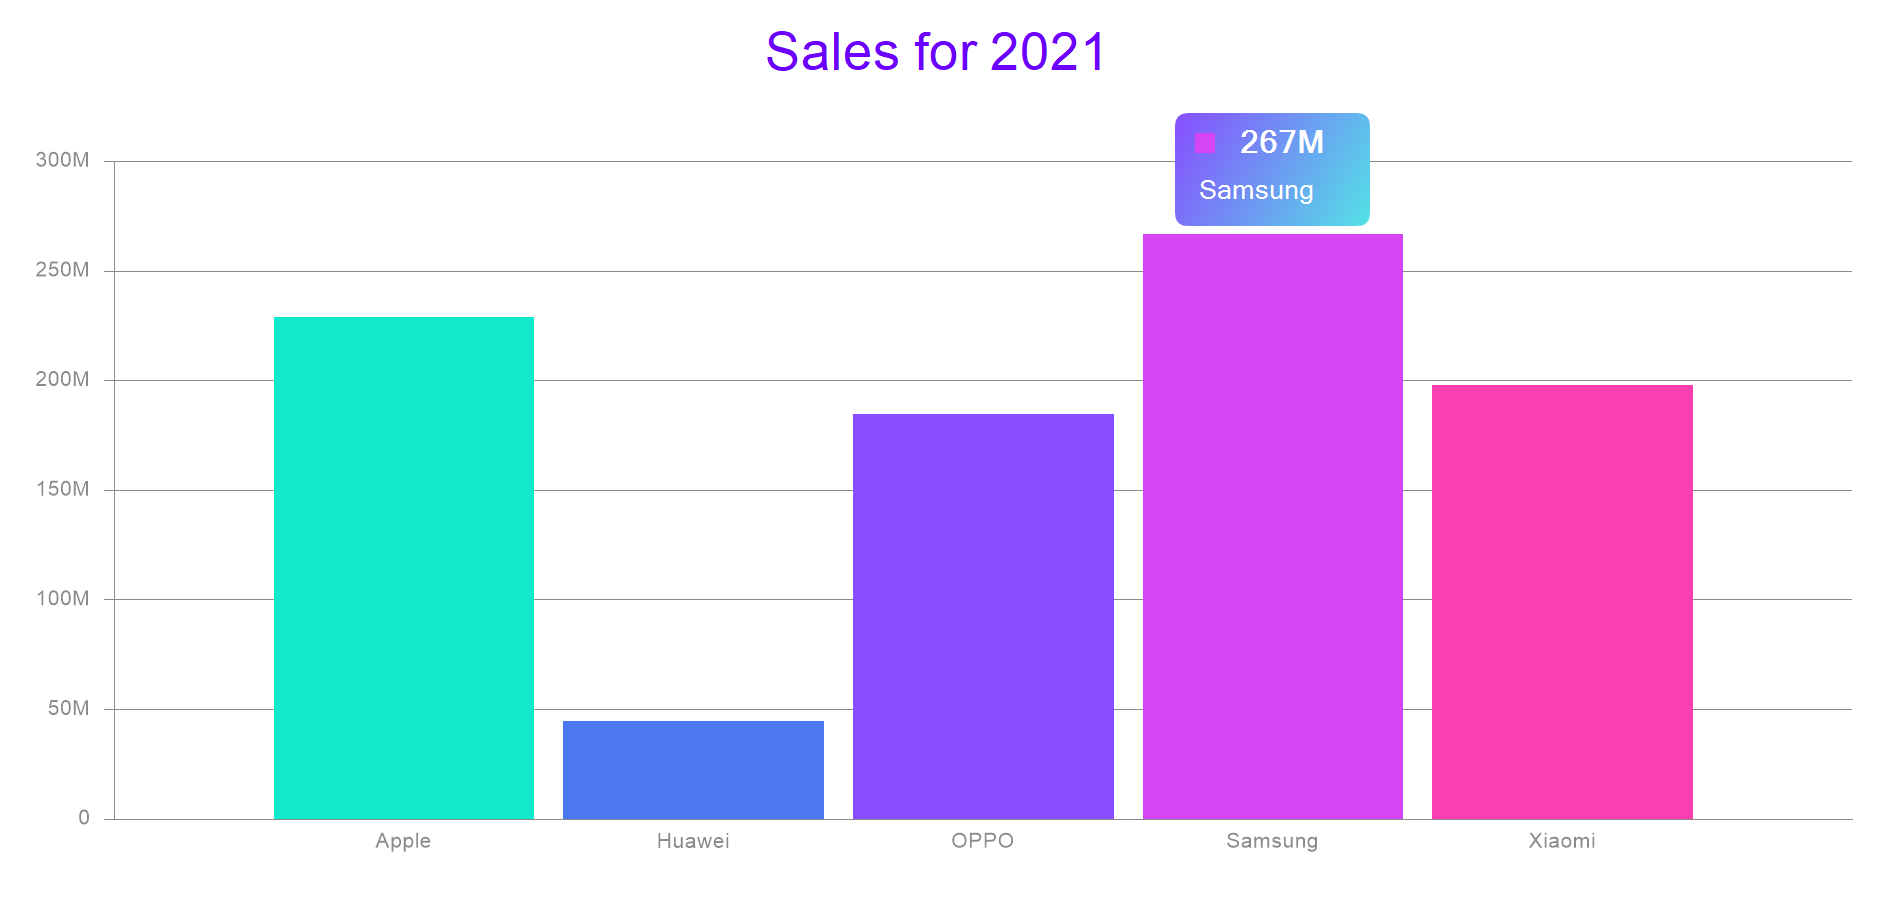
We have added an ability to visually design the Tooltip element when hovering the cursor for some dashboard elements – Chart, Region Map, Indicator. Tooltips are customized in the Style Designer using properties: Tooltip Brush, Tooltip Text Brush, Tooltip Corner Radius, and Tooltip Border. Now you can design tooltips for your dashboards according to your corporate company style or visual settings of dashboard elements. By the way, there is no separate property that sets the transparency of the tooltip background. But you can set it by specifying the alpha parameter in the color code for the Tooltip Brush property.
New features of the Pivot Table
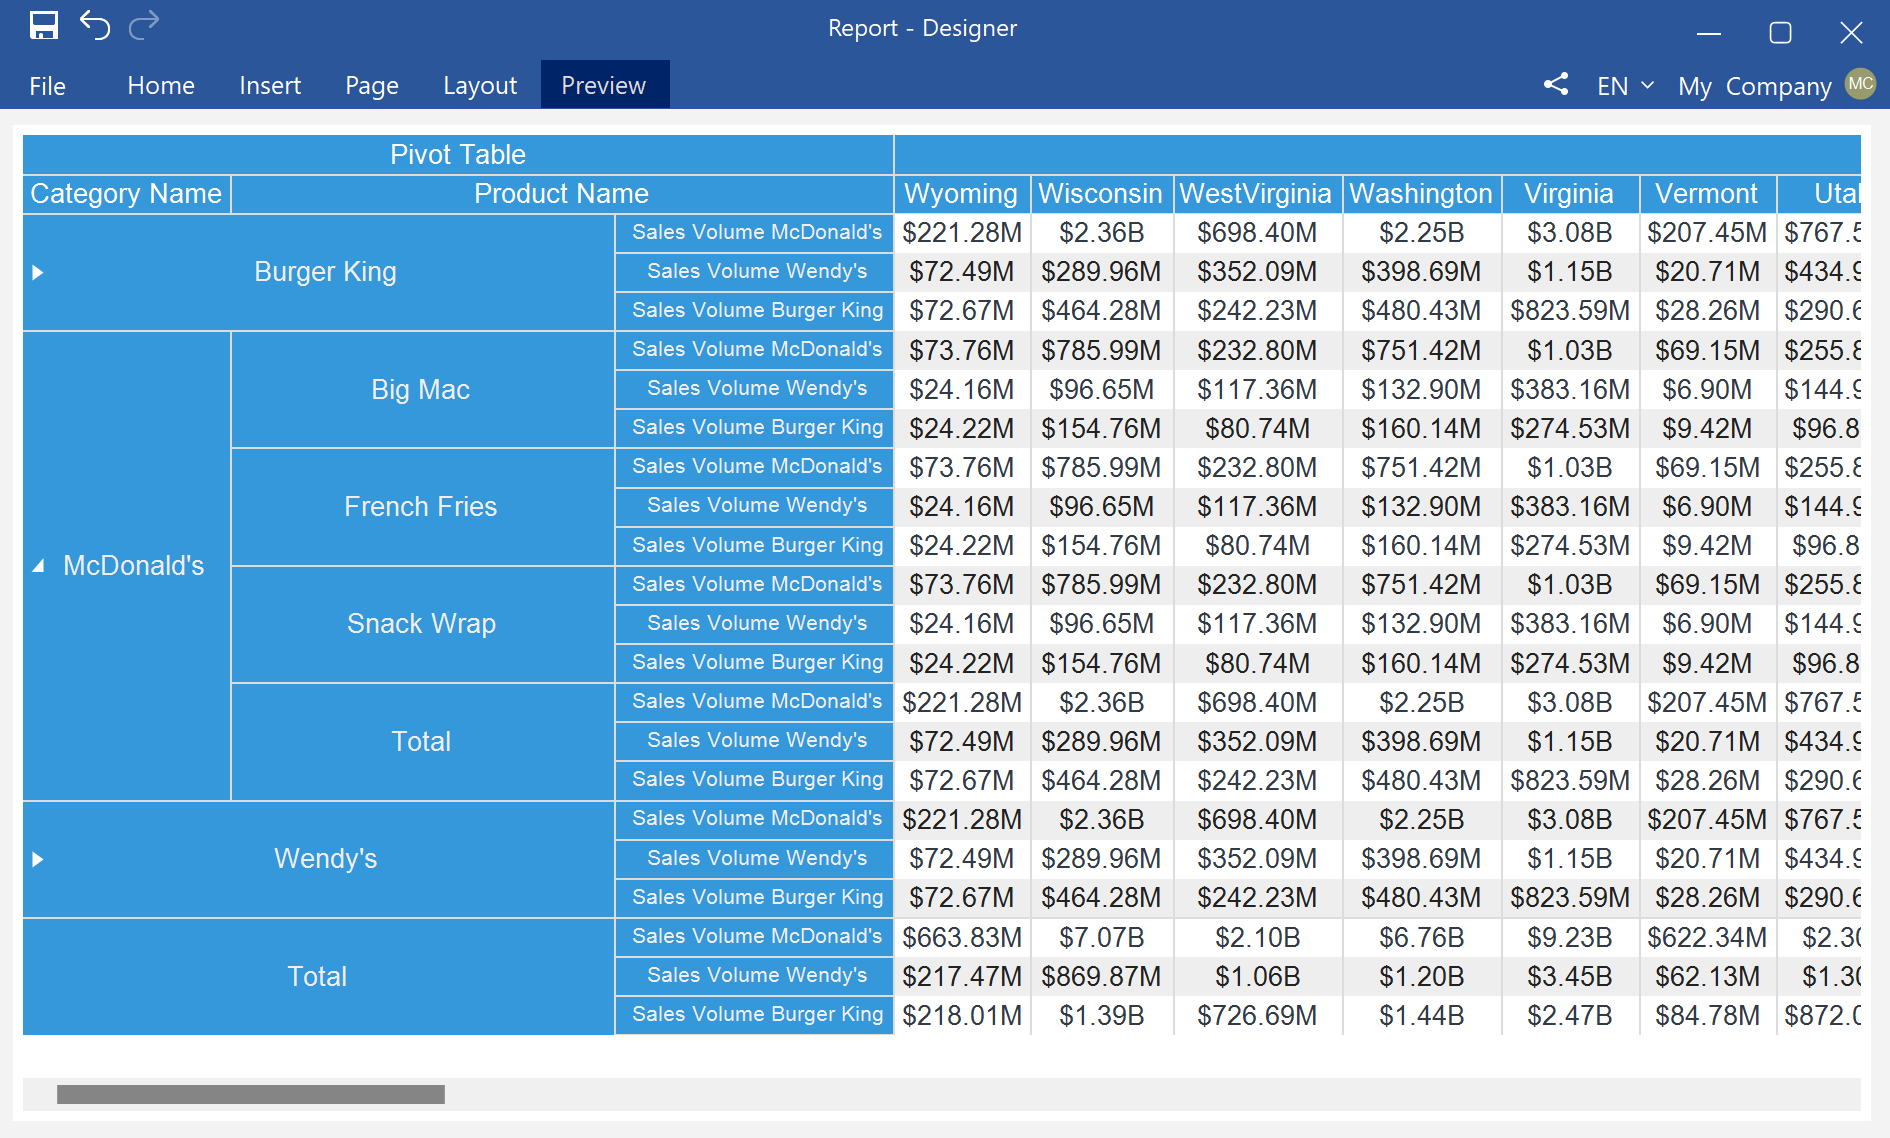
We have added several new features for the Pivot Table in dashboards. First, you can now sort rows and columns in ascending or descending directions. You can do this using the Sort property in the properties panel for the corresponding data fields. Second, you can define an expanded row or column condition when you use drill-down data. The condition to expand rows or columns is carried out in the Expand property editor in the properties panel.
Optimization of the JS designer

After a deep analysis, as a result of research and comparative tests, we decided to replace the framework for creating a desktop version of the JS report designer. Previously, NW.js was used. Now the standalone JS designer is built using Electron. As a result, we were able to optimize the speed of the application, including getting and processing data, report rendering, displaying dashboards, and reducing the application run time.
New features of the Cards
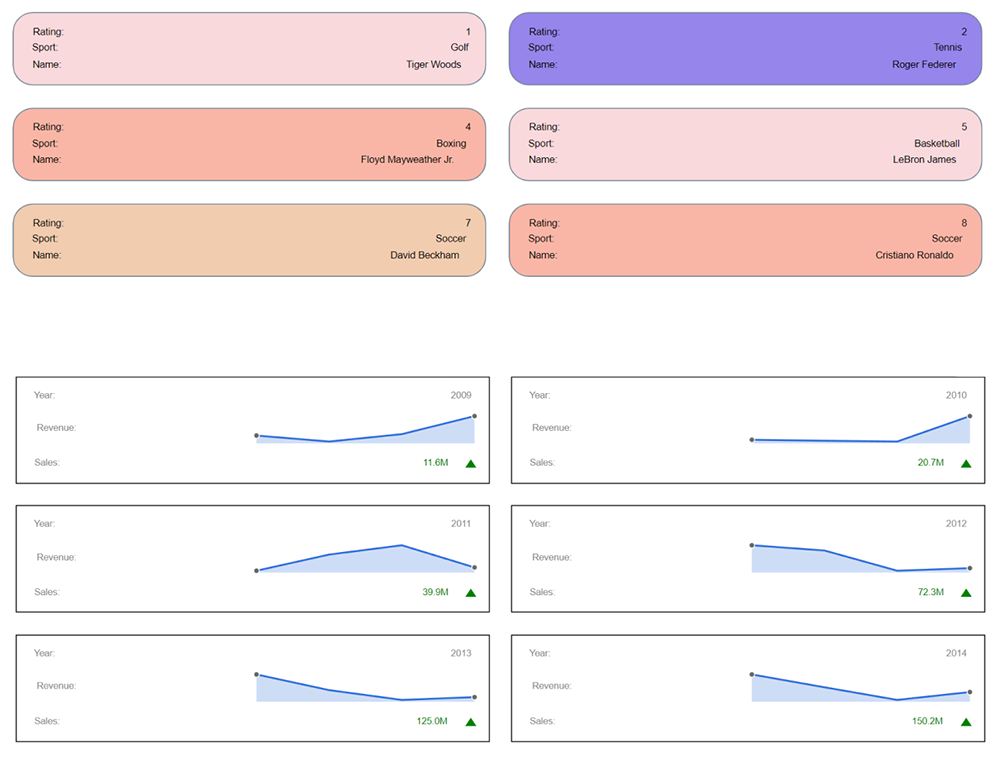
In spring 2022, we added a new element for dashboards - Cards. In the new version, we expanded the list of features for this element. The Cards element now supports the cross-filtering and grouping mode with dashboard elements. In addition, it is now possible to select a preset color collection to apply to cards or get this collection from the element style. You can do this using the Series Color property.
HTML preview modes
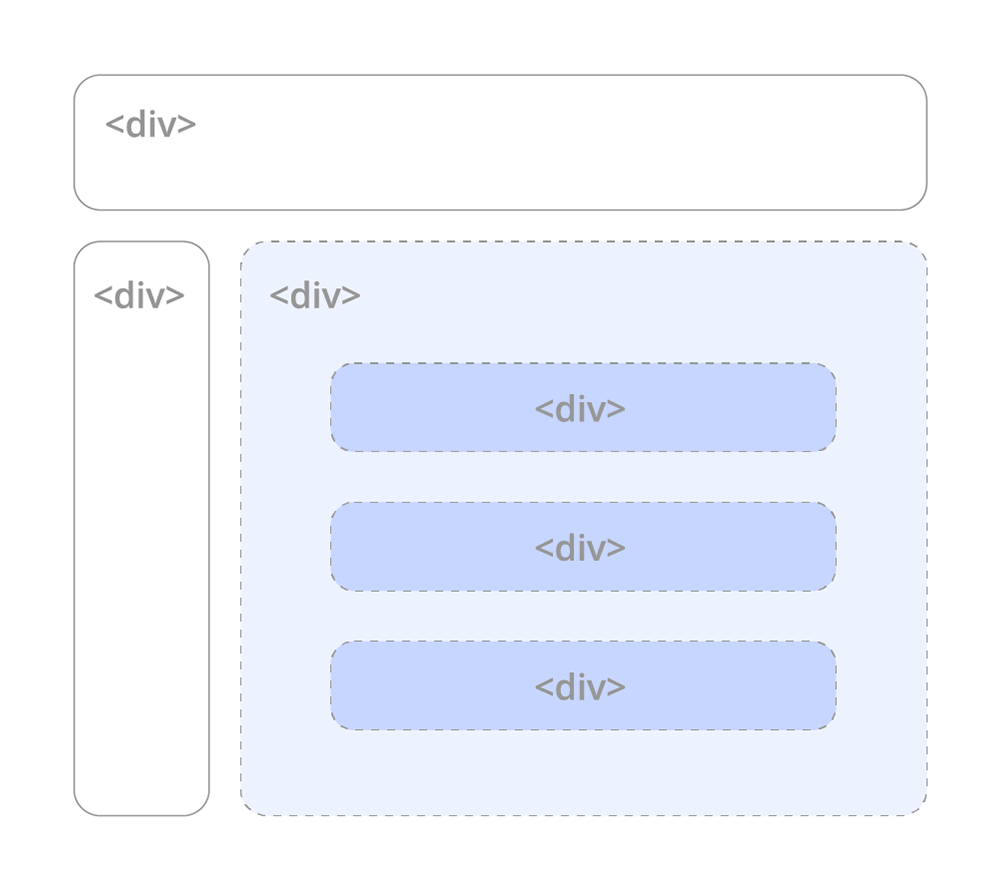
Starting with version 2022.3, you can define an HTML preview mode in the Preview Settings of a report. It’s relevant when creating a report in the desktop version of the report designer and its further viewing in a web browser. In earlier versions of the Web viewer, by default, you could use the TABLE mode to display reports, which had certain restrictions. You could switch to the DIV mode only when using the viewer option. Earlier, a selected mode was applied to all reports which were displayed in it, and the report template didn’t have any preview settings. Now a report creator can define the view mode as DIV or TABLE. It remains possible to define the preview mode for all reports at once, having set the appropriate value for the Web viewer option. By default, the preview mode in the viewer will be determined by the settings from a report.
New features for Maps

The new functionality in version 2022.3 also applies to maps in reports and GIS maps in dashboards. For the Map component in reports, the support of data drill down has been implemented. When clicking on a geographic object on the map, you can open another report page. For GIS maps in dashboards, the ability to specify a custom provider-server by URL, which considerably increases the flexibility of using this dashboard element in custom applications, is added.
ECMAScript 2017

Starting with the 2022.3 version, Reports.JS and Dashboards.JS products are switching to ECMAScript 2017 language standard. We have carried out load testing of the report generator under the new version, and according to their results, the processing of a multi-page report accelerated by more than 25%. New ES2017 features remove barriers to our product development and allow us to keep up with the times.
Optimizations for OTF fonts

In the previous version, when exporting a report to PDF and in cases of using a *.otf custom font in reports, the font file was completely embedded into the document, which, in turn, could significantly increase the size of a PDF file. We have done some optimizations for *.otf fonts, which will result in integrating only those font characters that are needed to render the text in the current report when embedding the font in the document. In many cases, this will reduce the size of the PDF file. For *.ttf fonts, this optimization has been implemented in previous versions.
New features of the WPF designer
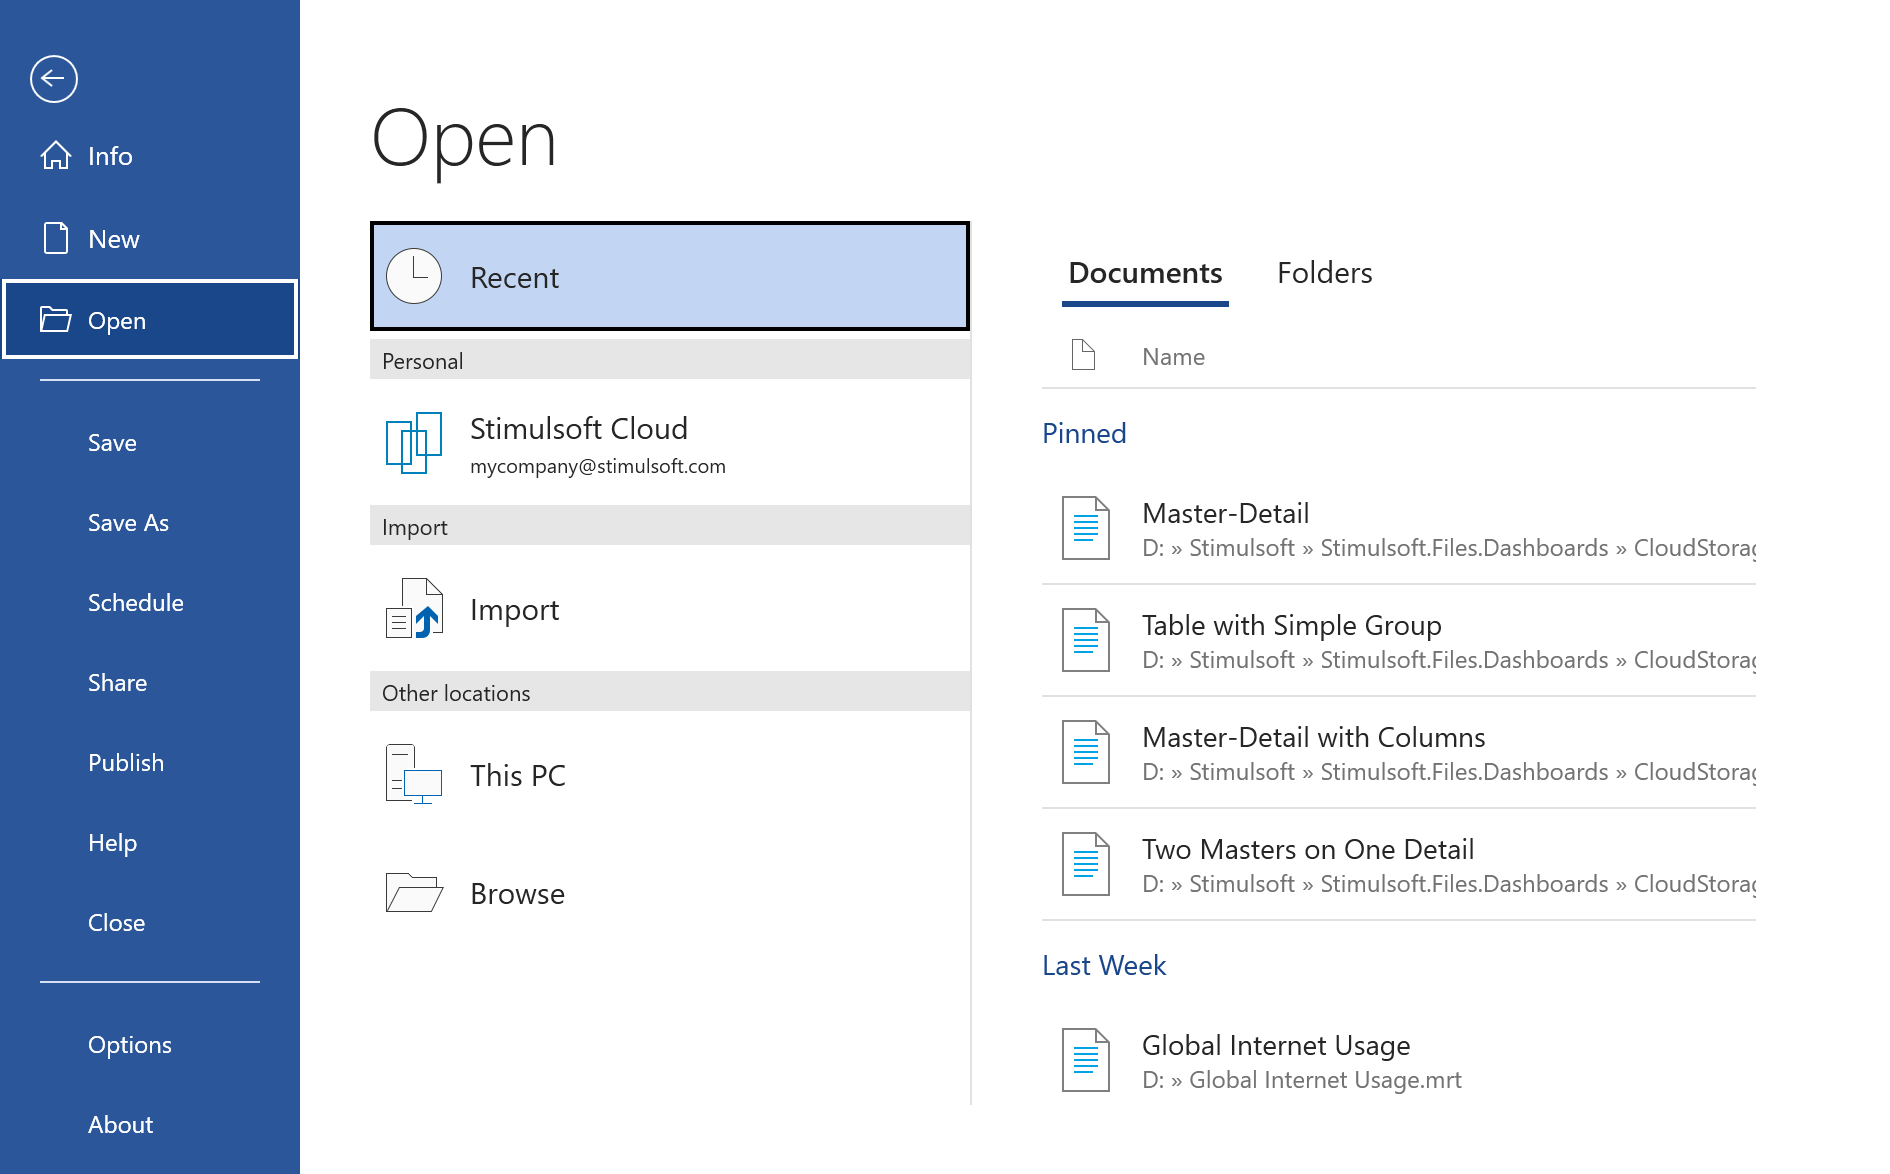
In this release, we have added the Code tab for the WPF v2 report designer. This tab is an analog of the same tab in the Stimulsoft Designer. By default, this tab is disabled, and you may find the parameter to enable it in the context menu of the header page of the report template. In addition, in the report designer, we have completely redesigned the menu for opening and saving reports, having adapted them to the Microsoft Office style. The menu includes options for searching, fixing frequently used reports, specifying local storage, etc.