Page 1 of 1
Chart based on grouping
Posted: Thu Aug 18, 2022 2:13 pm
by rth001
Hello,
Is it possible to create a chart based on grouped data? If yes, can you please provide some guidance.
My databand looks like
ProductID Value
2690 1
2690 2
2690 3
2691 1
2691 1
2691 1
My group header band looks like
Product Id Sum(Value)
2690 6
2691 3
I would now like to create a Chart based on the grouped values. Is this possible somehow?
thanks
Re: Chart based on grouping
Posted: Fri Aug 19, 2022 9:08 am
by Lech Kulikowski
Hello,
You can add the DataTransformation source with the necessary grouping, sorting, and calculations and then use it for the Chart component.
Thank you.
Re: Chart based on grouping
Posted: Fri Aug 19, 2022 11:22 am
by rth001
Hi Lech,
I heard about this,but have no idea how to access.
We are using the integrated Stimulsoft WPF Designer and I don't see this option.
We are using Business Objects
What is needed to activate the data transformation? (see screenshot)
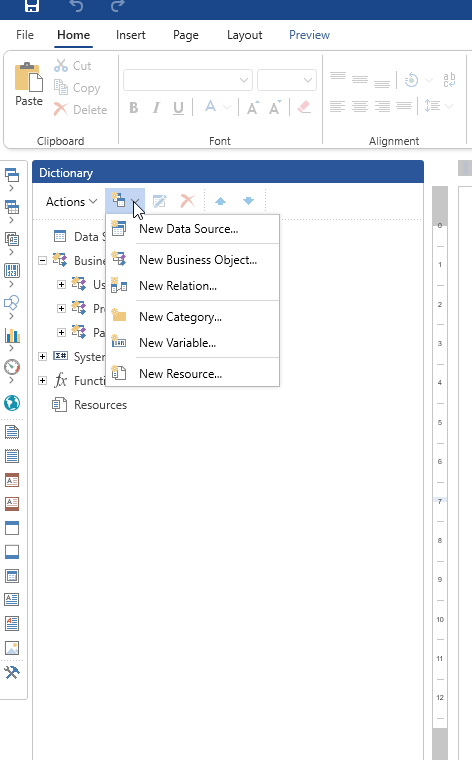
- 2022-08-19 13_19_36-Designer.png (30.35 KiB) Viewed 9801 times
Re: Chart based on grouping
Posted: Fri Aug 19, 2022 1:03 pm
by HighAley
Hello,
What version of our tool do you use?
Could you upgrade to the latest build?
Thank you.
Re: Chart based on grouping
Posted: Fri Aug 19, 2022 1:32 pm
by rth001
Hi,
We use 2022.3.2
Re: Chart based on grouping
Posted: Mon Aug 22, 2022 9:53 am
by HighAley
Hello,
Unfortunately, the data transformation is not available in WPF.
There is a Data Source from Other Data Source but you can't use it with Business Objects.
If you could register Business Objects with the RegData() method, it will be possible to aggregate data with Data Source from Other Data Source.
Otherwise you should modify your Business Objects and aggregate data on your side.
Thank you.