Page 1 of 1
field Datetime to Timespan in graph
Posted: Thu Dec 15, 2022 2:04 pm
by acataluffi
Hi,
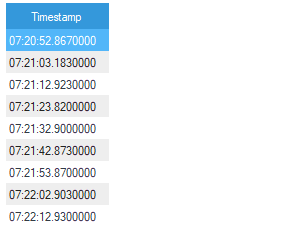
i have a field like '2022-12-12 18:43:41.520' and i want display '18:43:41' in the graph as x-Axis.
Foreach row i want Y-Axis the value and X-Axis his time. How I can do the conversion from Datetime to Timespan correctly?
I tried to change my field Data option to time in Chart argument but it display a number and not the time like '18:43:41'.
Re: field Datetime to Timespan in graph
Posted: Thu Dec 15, 2022 3:43 pm
by Lech Kulikowski
Hello,
You can use ToString() or TimeSerial functions.
Thank you.
Re: field Datetime to Timespan in graph
Posted: Thu Dec 15, 2022 4:11 pm
by acataluffi
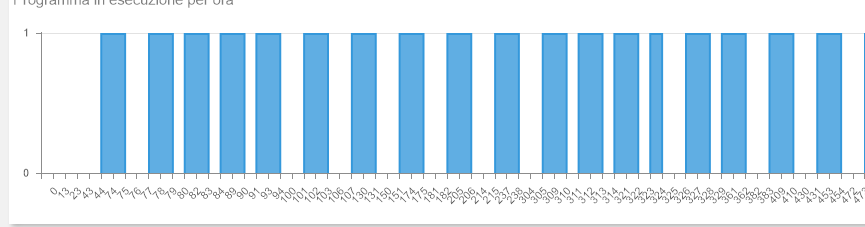
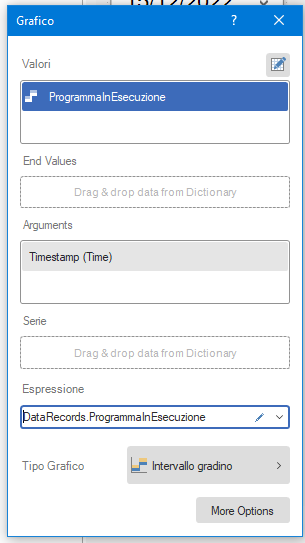
Can i do this on graph X-Axis?
I have date in a small time interval (10 seconds) and i don't know why my x-axis write a number instead of the value...
- scrren2.png (8.08 KiB) Viewed 13276 times
- screen.png (11.93 KiB) Viewed 13276 times
- screen3.png (16.13 KiB) Viewed 13276 times
Thanks
Re: field Datetime to Timespan in graph
Posted: Fri Dec 16, 2022 7:59 am
by Lech Kulikowski
Hello,
Please send us a sample report with test data that reproduces the issue for analysis.
Thank you.
Re: field Datetime to Timespan in graph
Posted: Fri Dec 16, 2022 9:45 am
by acataluffi
I noticed that with an high ratio of data it displays number, with a low ratio it displays data.
Low ration example and my expected result.
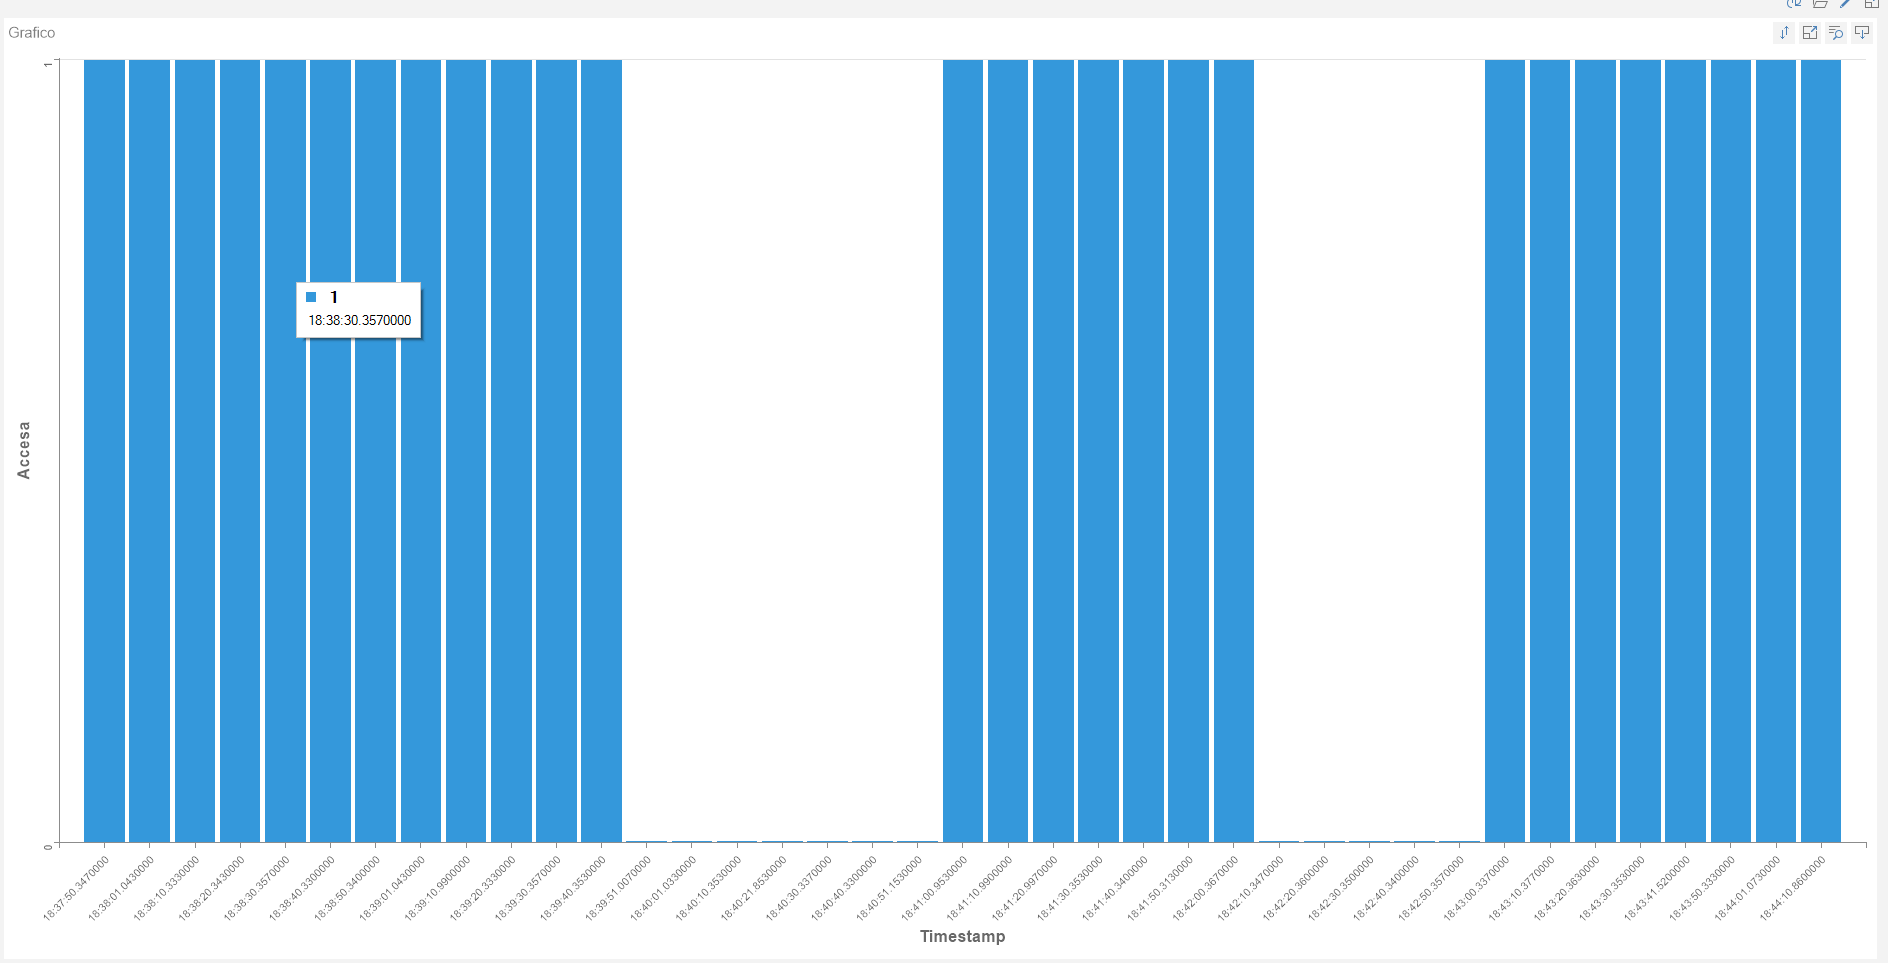
- example-screen.png (35.08 KiB) Viewed 13247 times
Anyway,
i attached high ration data and sample dashboard.
Thanks.
Re: field Datetime to Timespan in graph
Posted: Mon Dec 19, 2022 3:41 pm
by Lech Kulikowski
Hello,
We need some additional time to investigate the issue, we will let you know about the result.
Thank you.