Page 1 of 1
Chart with Time axis and Hour interval
Posted: Thu Dec 15, 2022 3:49 pm
by acataluffi
Hi,
i'm trying to create a graph with X-Axis the time value but display only hour step.
Is it possible display on x-Axis 24-hour step? And then load the data.
Thanks.
Re: Chart with Time axis and Hour interval
Posted: Fri Dec 16, 2022 7:59 am
by Lech Kulikowski
Hello,
Depends on the data. Could you send us test data and the necessary result?
Thank you.
Re: Chart with Time axis and Hour interval
Posted: Fri Dec 16, 2022 9:51 am
by acataluffi
I want the 24h line axis, then the bars where field is 1.
Expected result something like this (x-axis)
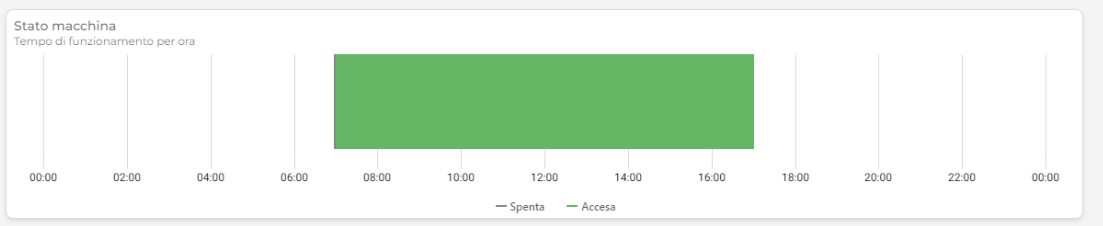
- expected.png (15.73 KiB) Viewed 9443 times
This is the sample data.
Thanks.
Re: Chart with Time axis and Hour interval
Posted: Fri Dec 16, 2022 4:13 pm
by Max Shamanov
Hello,
Unfortunately, we don't have a timeline chart.
But please check out an alternative solution by using a scatter chart.
Thank you.
Re: Chart with Time axis and Hour interval
Posted: Tue Dec 20, 2022 9:15 am
by acataluffi
Hello,
I work with Dashboard and I don't find the same funtionality enabled there.
Thank you.
Re: Chart with Time axis and Hour interval
Posted: Tue Dec 20, 2022 1:07 pm
by Max Shamanov
Hello,
Ok.
Let us know if you need our help.
Thank you.