Page 1 of 2
Charting Data
Posted: Tue May 23, 2023 5:00 am
by brett.macpherson
Hi,
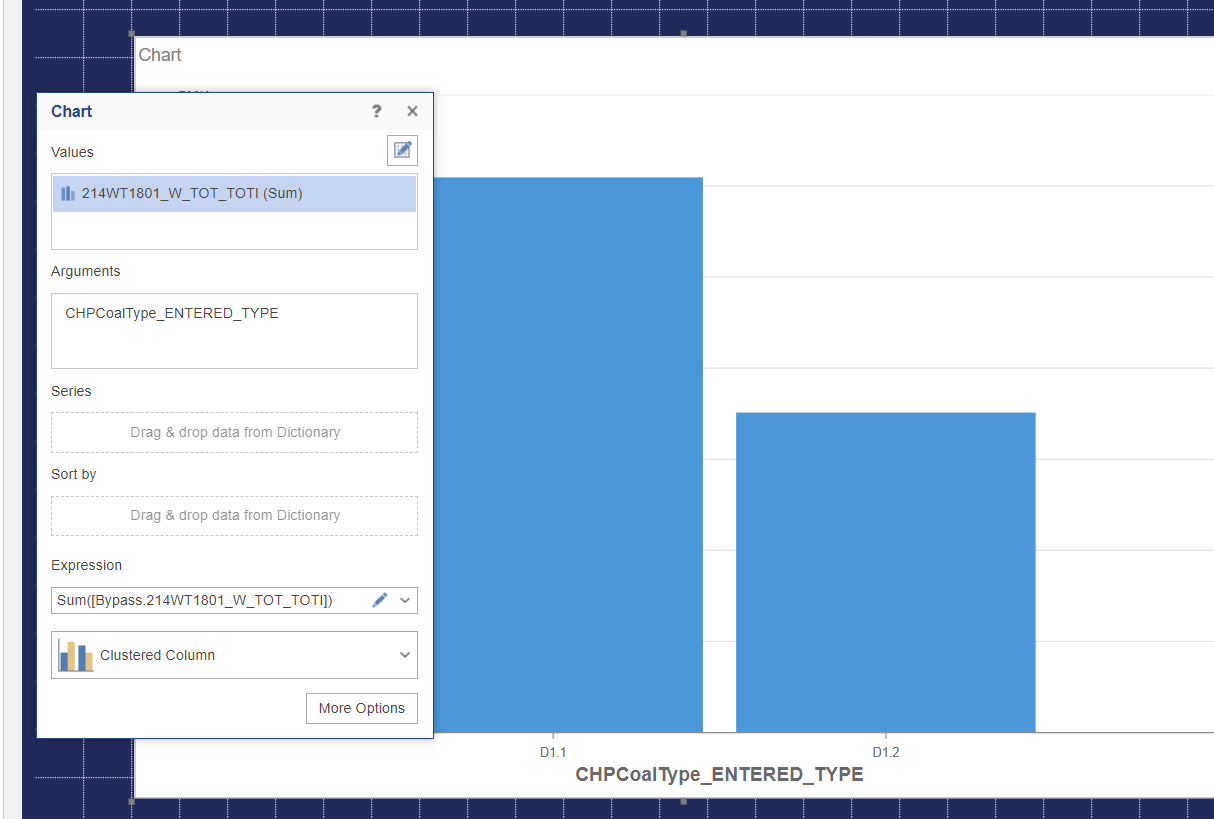
i'm trying to create a simple chart in a report, having used the dashboards product alot I thought this would be trivial but it isn't behaving how i'd expect. In dashboards I simply drag on a value, specify and aggregate and an argument and bang it's all done. Tried the same in reports and it doesn't have a place for the aggregate and insists on drawing every row of the data provided instead of grouping them together as per the arguement. How do i get this to behave like it does in dashboards?
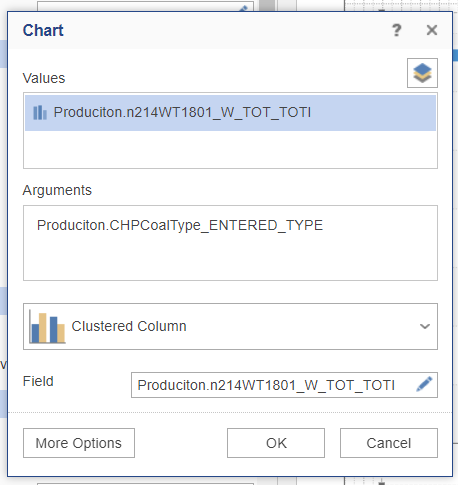
Dashboard Config/chart
- Dashboard Chart.png (43.37 KiB) Viewed 12354 times
Report Config
- Report Chart Config.png (20.44 KiB) Viewed 12354 times
Report Chart
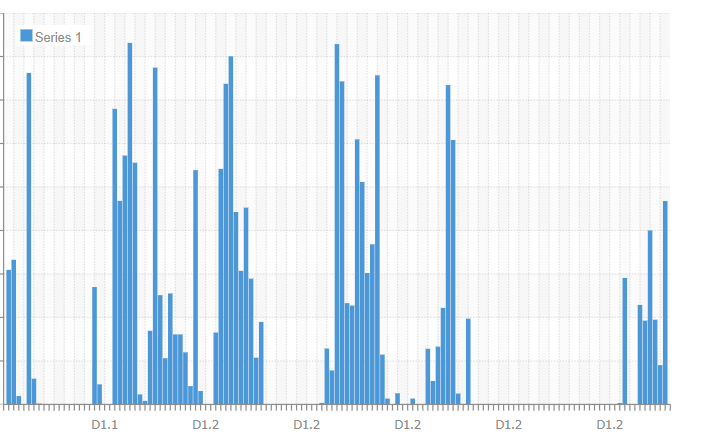
- Report Chart.png (77.49 KiB) Viewed 12354 times
Re: Charting Data
Posted: Tue May 23, 2023 10:50 am
by Max Shamanov
Hello,
Could you please send us a sample report with test data?
Thank you.
Re: Charting Data
Posted: Fri Jun 02, 2023 1:48 am
by brett.macpherson
Hi,
please see attached. you can see that in the dashboard it applies a sum aggregate to the data grouping them by the argument. Yet in the report it doesn't behave like this at all. Why is the behaviour so different between reports/dashboards and how do i get reports to behave like dashboard (ie applying an aggregate to like variables based on the arguements).
Re: Charting Data
Posted: Fri Jun 02, 2023 8:26 am
by Max Shamanov
Hello,
You can use Data Transformation to achieve the same behavior in the report chart.
Please see the attached report with some modifications.
Thank you.
Re: Charting Data
Posted: Mon Jun 05, 2023 12:31 am
by brett.macpherson
thank you.
In our implementation we had the dictionary right click menu disabled as part of locking down access to adding/viewing the data sources as this is handled externally. But it also hid this data transformations menu.
I've managed to alter our implementation to be able to add data transformations yet still hide all access to the data sources.
Non essential question but why the different behaviours between dashboards and reports? to my way of thinking you'd want them to behave very similarly with this task being trival in dashboards yet quite tricky in reports.
Re: Charting Data
Posted: Tue Jun 06, 2023 1:26 pm
by Max Shamanov
Hello,
You are welcome!
Non essential question but why the different behaviours between dashboards and reports?
Reports use a different algorithm to build graphs that can display more data.
Thank you.
Re: Charting Data
Posted: Tue Aug 01, 2023 7:01 am
by brett.macpherson
Hi,
a follow up question. With our implementation of Reports we manage the data sources within the dictionary through a different page of our website. As such most of the right click and configuration menu are disabled with the below code. Which was doing exactly what we wanted but now we'd like to allow the user to configure data transformations but not be allowed to edit/modify the database connections/queries. I've been playing with the permissions but can't get it to do what i want. With reference to the attached screen grab i am trying to allow all permissions on the data transformations. But limit permissions to view on the database item. I've set the StiWebDesigner1.PermissionDataSources to view and the StiWebDesigner1.PermissionDataTransformations to all. No matter what combonation i use the permissions for the data transformations modify/edit button is always the same as the database permission. When i set the PermissionDataTransformations to all it allows me to create a data transformation through the control/right click menu, but the modify/delete buttons following the PermissionDataSources option. So it seems as though there is an error here in the product, surely setting the PermissionDataTransformations to all would allow me to edit a previously created data transformation. So finally the question, is it possible to set different permission on the data transformation to have full permissions while the database only has view permissions?
//
StiWebDesigner1.PermissionBusinessObjects = StiDesignerPermissions.None;
StiWebDesigner1.PermissionDataColumns = StiDesignerPermissions.View;
StiWebDesigner1.PermissionDataConnections = StiDesignerPermissions.View;
StiWebDesigner1.PermissionDataRelations = StiDesignerPermissions.None;
StiWebDesigner1.PermissionDataSources = StiDesignerPermissions.View;
StiWebDesigner1.PermissionDataTransformations = StiDesignerPermissions.All;
StiWebDesigner1.PermissionResources = StiDesignerPermissions.None;
StiWebDesigner1.PermissionSqlParameters = StiDesignerPermissions.None;
StiWebDesigner1.PermissionVariables = StiDesignerPermissions.All;
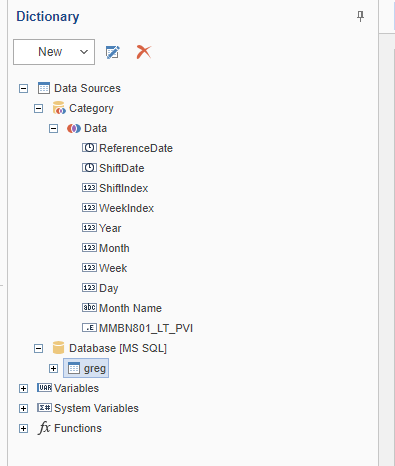
- Report data transformation permissions.png (15.61 KiB) Viewed 12192 times
Re: Charting Data
Posted: Tue Aug 01, 2023 12:43 pm
by Max Shamanov
Hello,
We need some additional time to investigate the issue, we will let you know about the result.
Thank you.
Re: Charting Data
Posted: Tue Aug 15, 2023 3:29 pm
by Max Shamanov
Hello,
You can add restrictions for this, please check the following code:
report.Dictionary.Restrictions.Add("Test", Stimulsoft.Report.Dictionary.StiDataType.DataSource, Stimulsoft.Report.Dictionary.StiRestrictionTypes.DenyEdit);
Thank you.
Re: Charting Data
Posted: Fri Aug 18, 2023 10:07 am
by brett.macpherson
Hi Max,
thanks for the response, i ended up using something quite hacky by intercepting the mouseup, checking the datasource type and momentarily changing it when it does the security check (see below). In anycase with your or my workaround the intent is to allow independant control on either a data source or data transformation which does not work so surely this can be listed as a bug and should be rectified? With the hack i have below there is no guareentee that it will keep working so i would ask that this bug be fixed.
Thankyou.
dictionaryPanel.onmouseup = function (event) {
//
var selectedItem = jsStiWebDesigner1.options.dictionaryTree.selectedItem.itemObject;
if (selectedItem.typeDataSource != undefined) {
if (selectedItem.typeDataSource == "StiDataTransformation") {
selectedItem.typeItem = "DataTransformation";
dictionaryPanel.toolBar.updateControls();
selectedItem.typeItem = "DataSource";
}
else
dictionaryPanel.toolBar.updateControls();
}
else
dictionaryPanel.toolBar.updateControls();
};