
Introducing Dashboards.PYTHON - a fast and powerful tool for creating analytical dashboards in services and projects written in Python. The product includes a JavaScript data processing engine, a designer component for creating dashboards, and a fully interactive viewer for viewing ready-made dashboards on the screen of any device.
Learn more
Creating dashboards
The dashboard designer is a key tool in our product, serving as an editor for creating dashboard layouts. Users can connect data from various sources, further structure it using grouping and sorting features, and apply visual design elements.
The dashboard designer is available as a standalone BI Designer application for installation and working on Windows, macOS and Linux operating systems. Additionally, it is accessible as an online service at designer.stimulsoft.com, offering the same functionality. Explore either the desktop or web version of the tool to familiarize yourself with the designer and its integration into your applications.
Event handler
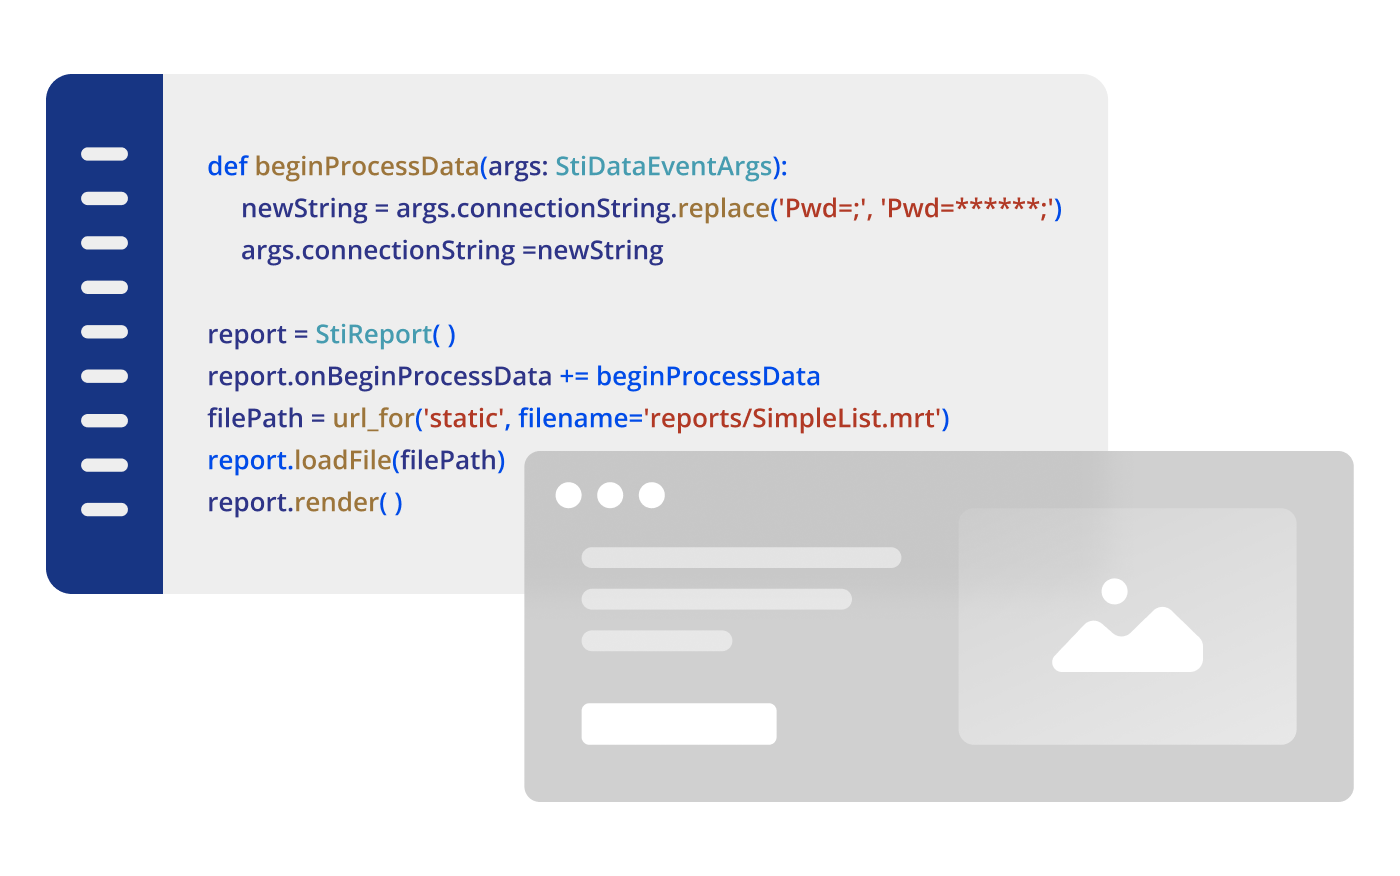
An event handler is a functionality designed to simplify the entire sequence of working with data between the client and the server. Stimulsoft Dashboards.PYTHON is a client-server system wherein a JavaScript component operates on the client side, and a Python server is responsible for data processing. With the event handler, you can automate the processes of transferring data from the client side to the server side, processing it, and transferring it back using just a few lines of code. The event handler executes all actions on both the client and the server and also provides functionality for complete control over them.
Dashboard visualization
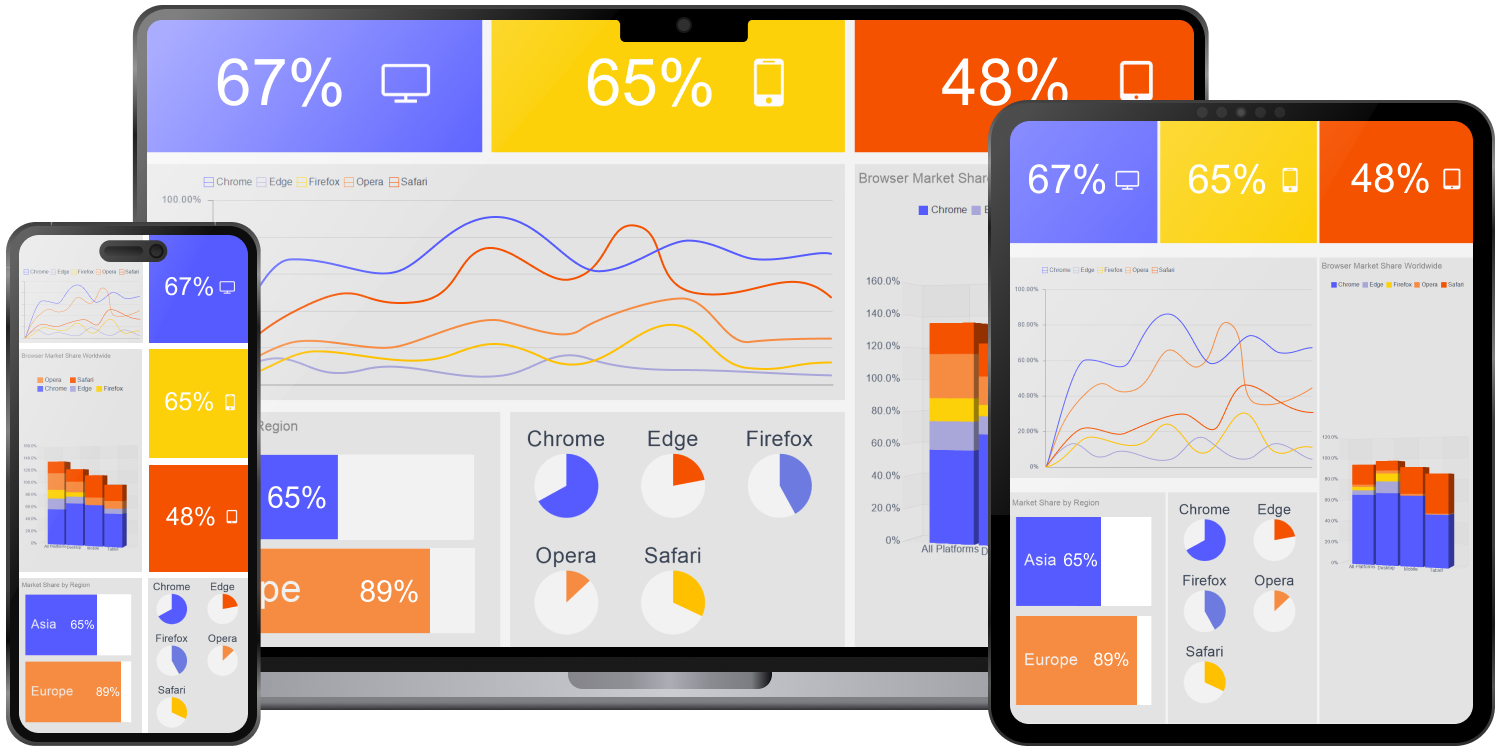
The most crucial stage of working with data is their visualization. For this task, the Dashboards.PYTHON product utilizes a special tool - a viewer designed to display ready-made dashboards in Python applications. The dashboard viewer is fully customizable, fast, and user-friendly. To ensure integration into projects, we offer a variety of design themes and options for customizing the application's appearance and functionality.
Integration
We aimed to develop a product for the simplest integration of a JavaScript data analytics tool into any Python web projects. Special functions have been incorporated to facilitate integration into projects utilizing popular web frameworks such as Django, Flask, and Tornado. To enable full functionality of the components, simply install the Python package and add a few lines of code to the project; all HTML and JS code will be deployed automatically.

Django

Flask

Tornado
Stimulsoft Ultimate

Stimulsoft Dashboards.PYTHON is part of Stimulsoft Ultimate, a universal set of data analytics and visualization components for all modern platforms - JavaScript, ASP.NET, .NET Core, Java, PHP, Blazor, Angular, Python, WPF, WinForms, and others. Today, Ultimate includes 10 reporting products, 7 dashboard data analytics products, and interactive form tools for Angular.
More about Ultimate