Stimulsoft Reports and Dashboards 2026.4 is now available!
Posted: Mon Oct 05, 2026 10:22 am
We are happy to announce the release of Stimulsoft Reports and Dashboards 2026.4! As always, this version brings many new features and improvements, including a new Markdown component, the Sankey chart, expression checking in dashboards, .NET 11 support, and much more.
Markdown component
In version 2026.4.1, we have added a new Markdown component for reports. It allows you to display formatted text with headers, lists, tables, images, links, code blocks, and much more. The Markdown component supports the full official CommonMark 0.31.2 specification and the GitHub Flavored Markdown (GFM) extension. You can edit Markdown content directly in the component editor.
Sankey chart
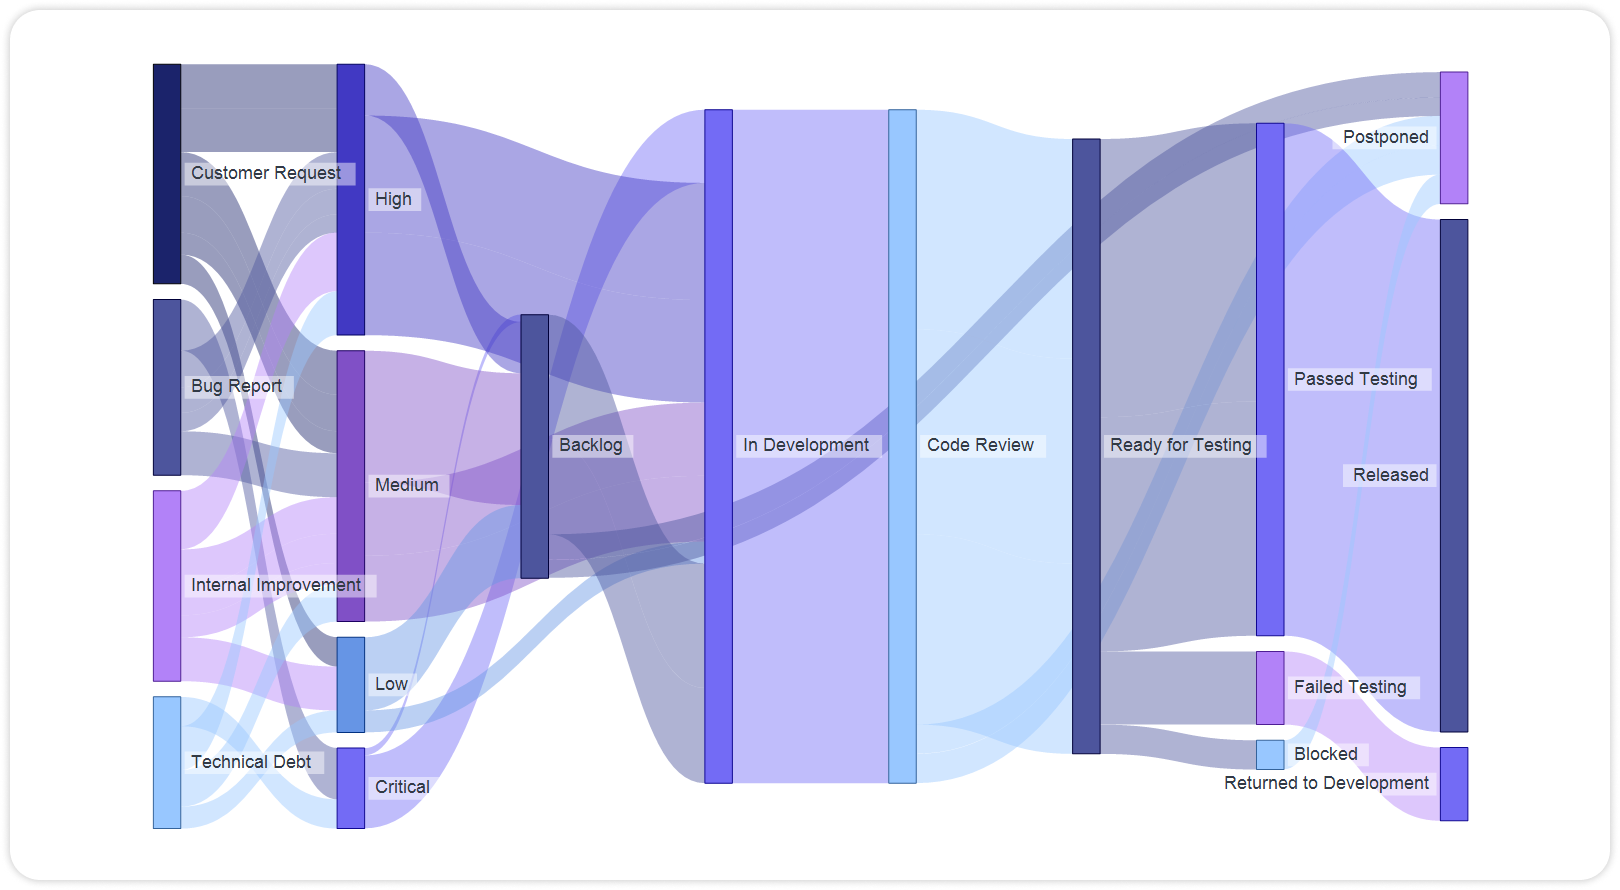
A new chart type, Sankey, is now available in reports and dashboards. You may use it for visualizing budgets, resource flows, sales funnels, and more.
.NET 11 support
.NET 11 Release Candidate 1 was released on September 8, 2026. We have tested Stimulsoft components for compatibility with .NET 11 RC1. They can now be integrated into projects that use this new framework version.
Sparklines in Cross-Tab and Pivot Table
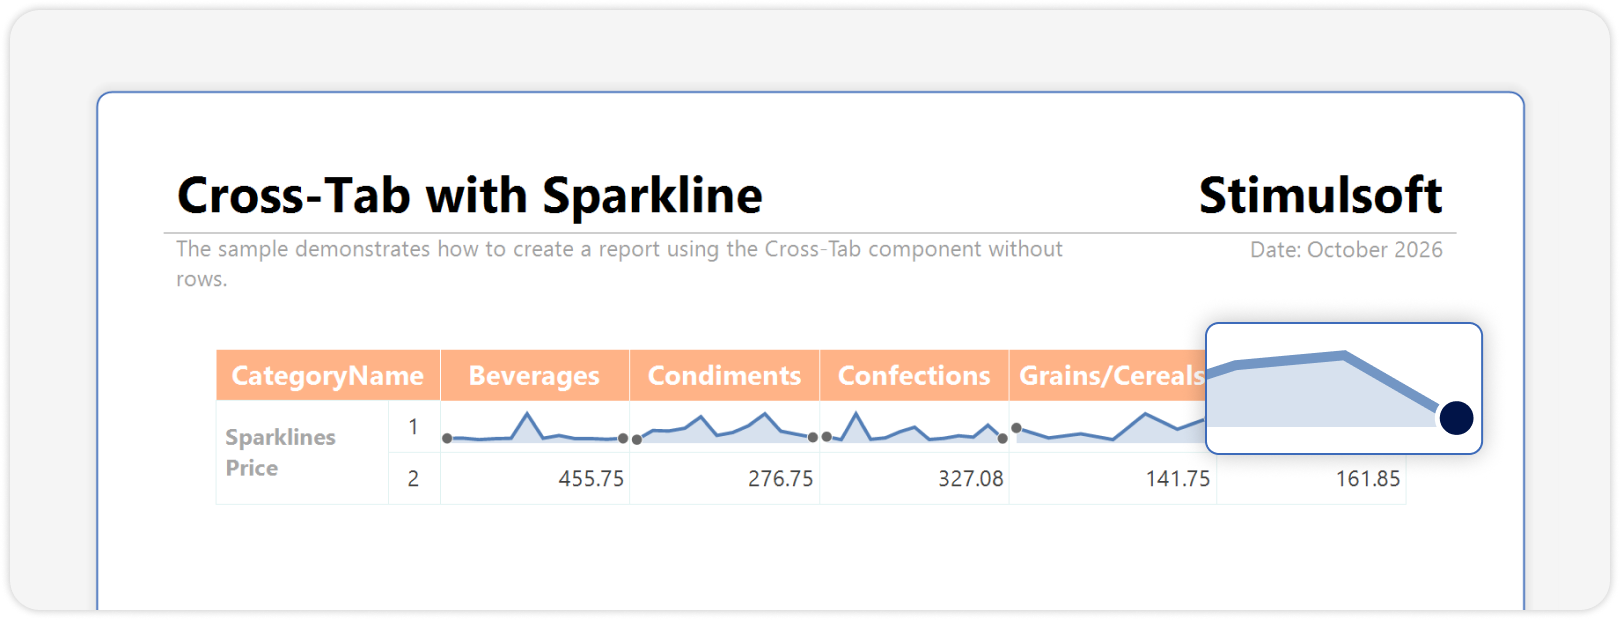
You can now display sparklines in cells of the Cross-Tab component in reports and the Pivot Table element in dashboards. These small charts show data trends directly in table cells, without the need for a separate chart.
Business Objects in JavaScript

Stimulsoft Reports.JS now allows you to register JavaScript objects from your application as business objects for reports and dashboards. The data dictionary is synchronized automatically, including nested objects and collections. This lets you pass data to reports in the same structure that is already used in your application.
New Chart types in Java
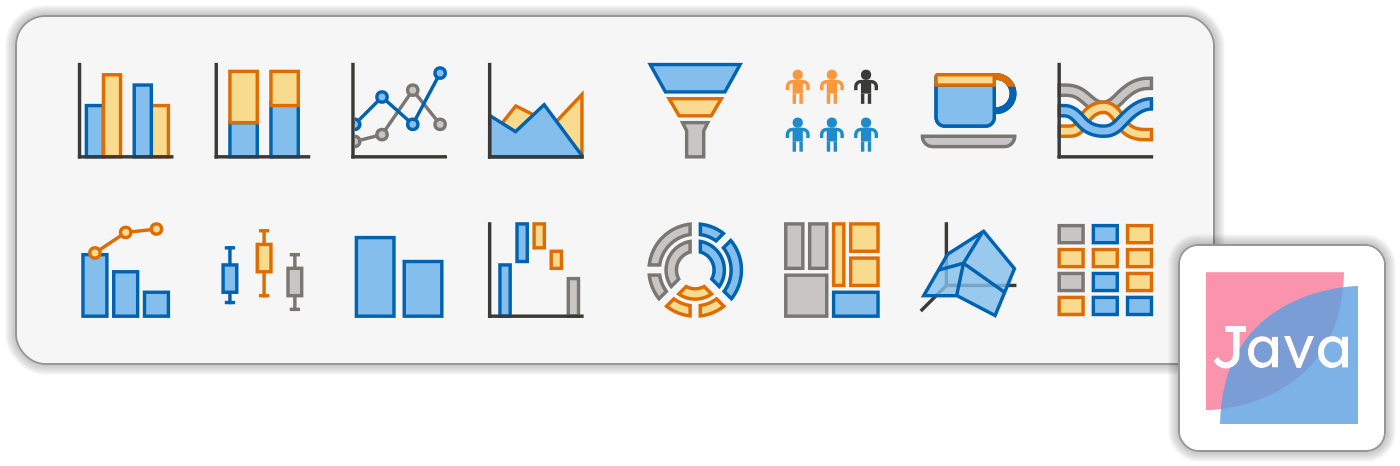
Stimulsoft Reports.JAVA now includes 17 additional chart types: Clustered Column, Stacked Column, Full Stacked Column, Line, Area, Wireframe Surface, Box and Whisker, Histogram, Pareto, Waterfall, Funnel Weighted Slices, Heatmap, Pictorial, Pictorial Stacked, Ribbon, Sunburst, Treemap. These new chart types make it easier to use the same report templates across different platforms, including .NET, JavaScript, and Java.
Relations from Foreign Keys
When you create an SQL data source or synchronize the data dictionary, relations are now created automatically based on foreign keys in the database. This feature supports MS SQL, MySQL, MariaDB, PostgreSQL, Oracle, Firebird, SQLite, SQL CE, Access, Teradata, Snowflake, DuckDB, and VistaDB. It also supports ODBC and OLE DB connections in .NET products and JDBC connections in Stimulsoft Reports.JAVA.
Expression Checker in Dashboards
Expression checking is now available in editors for dashboard elements such as Table, Cards, and Chart, among others. If an expression contains an error, a message appears below the input field. The Report Checker also checks expressions used in dashboard elements, including tooltips, hyperlinks, and interaction settings. It can report unknown functions, missing data columns, and errors in filters and conditions.
DuckDB adapter support

A new adapter for the DuckDB data source is now available. You can use DuckDB data to create reports and dashboards. Automatic import of relations from foreign keys is also supported.
Microsoft.Data.SqlClient adapter for MS SQL
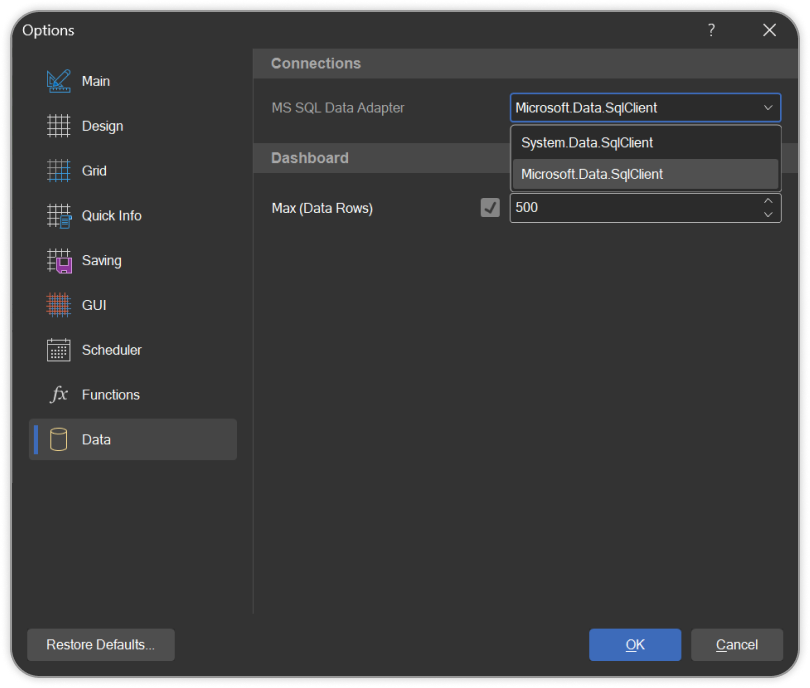
You can now use the Microsoft.Data.SqlClient adapter to connect to MS SQL data sources. In .NET 6 and later, this adapter is used by default. In components for .NET Framework 4.6.2, you can enable it by setting StiOptions.Dictionary.UseMicrosoftDataSqlClient to true. In Stimulsoft Designer for Windows, select Microsoft.Data.SqlClient in the MS SQL Data Adapter setting on the Data tab in the Options window. This adapter provides new options, including support for SQL Server strict encryption (Encrypt=Strict).
Avalonia 12 support
The Stimulsoft components for AvaloniaUI have been updated to support Avalonia 12. Since Avalonia 12 includes breaking changes, starting with version 2026.4.1, Stimulsoft components support only this framework version. These components are included in Stimulsoft Ultimate.
Micro QR Code
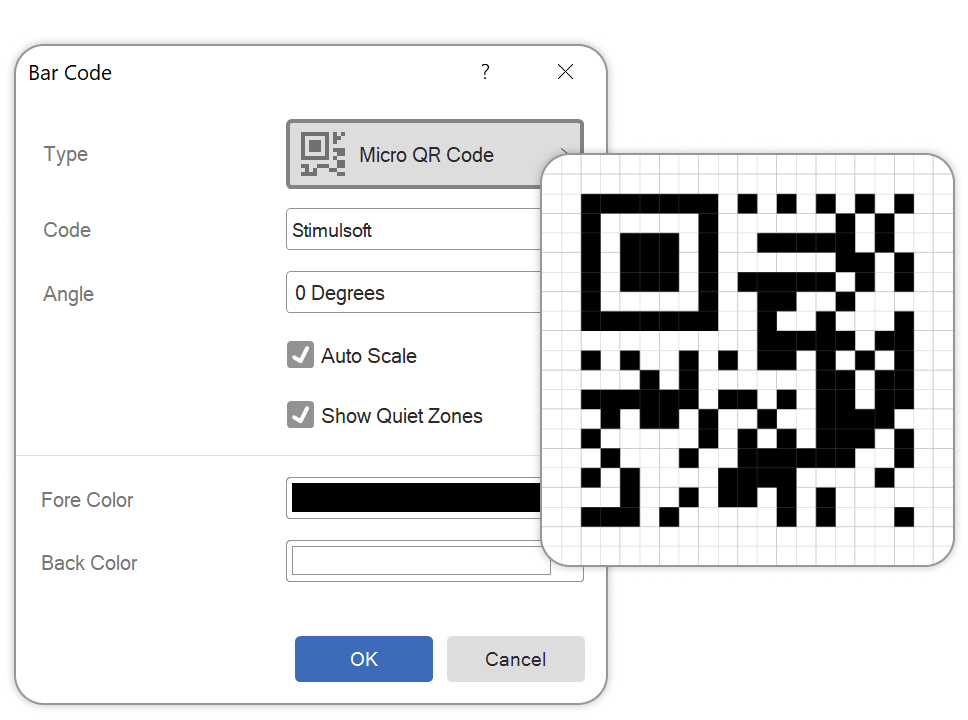
Reports now support the Micro QR Code, a compact version of the QR code designed for small products and labels. It supports versions M1-M4, with automatic version selection, numeric, alphanumeric, and byte data, as well as L, M, and Q error correction levels. By default, the component selects the highest error correction level that allows the data to fit into the code.
WebP image support

Stimulsoft components for WinForms now support images in the WebP format. WebP images are displayed in the Designer and Viewer and can be exported correctly to PDF, Excel, HTML, and image formats. This support is provided through a separate Stimulsoft.WebP assembly available via NuGet.
Chart colors from data
In dashboards, you can now set chart element colors using values from a data column. The data source can provide colors as HEX or RGB codes or as names such as "Red" or "White". This option is available for Pie, Pie 3D, Doughnut, Funnel, Treemap, Sunburst, and Pareto charts, as well as clustered column and bar charts.
Smart Guides in Web Designer
Smart Guides have been added to the web report designer. When you move or resize a component, the guides show how it aligns with other components on the page. This makes it easier to position report elements accurately.
Functions MonthYear, QuarterYear, WeekYear, DayMonthYear
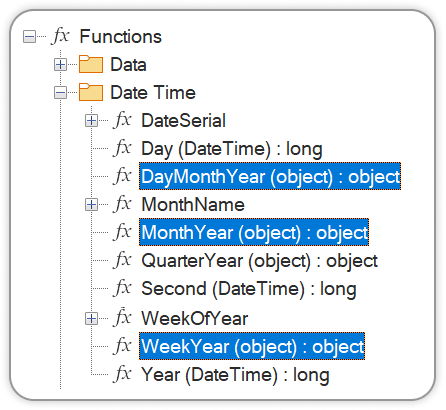
New functions are now available in reports and dashboards: MonthYear, QuarterYear, WeekYear, and DayMonthYear. They group data by month, quarter, week, or day while taking the year into account. This helps keep data in the correct chronological order. Labels are displayed according to the report's selected culture.
RowNumber and Rank functions
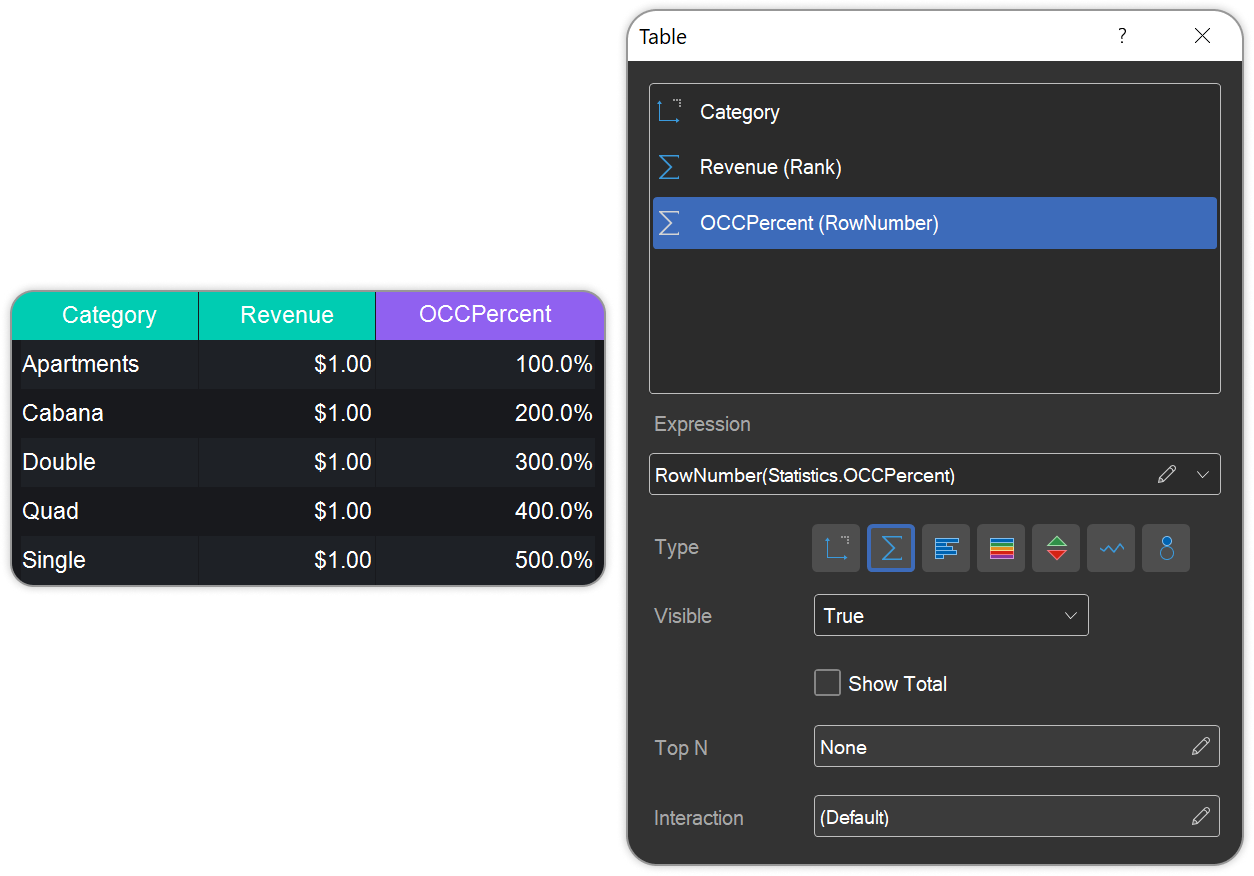
Two new functions, RowNumber() and Rank(), are now available in dashboards. RowNumber() returns the row number (1..N) in the final sorted result. Rank() ranks values in descending order: equal values receive the same rank, and the next rank is skipped, as in SQL. For example: 1, 2, 2, 4.
GetLabels function
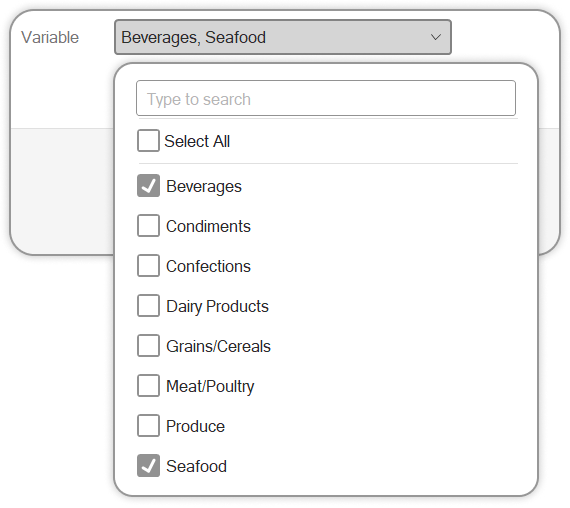
The GetLabels function is now available for List variables displayed in the viewer's parameter panel. It returns the labels of selected items instead of their keys. You can then use these labels in queries and expressions. For example: GetLabels("Cities").ToQueryString()
Filters Window in Data Transformation
A new Filters window has been added to the Data Transformation editor. It allows you to set filter conditions for different data columns. You can combine conditions using the And and Or logical operators.
Expressions in Pivot Table conditions
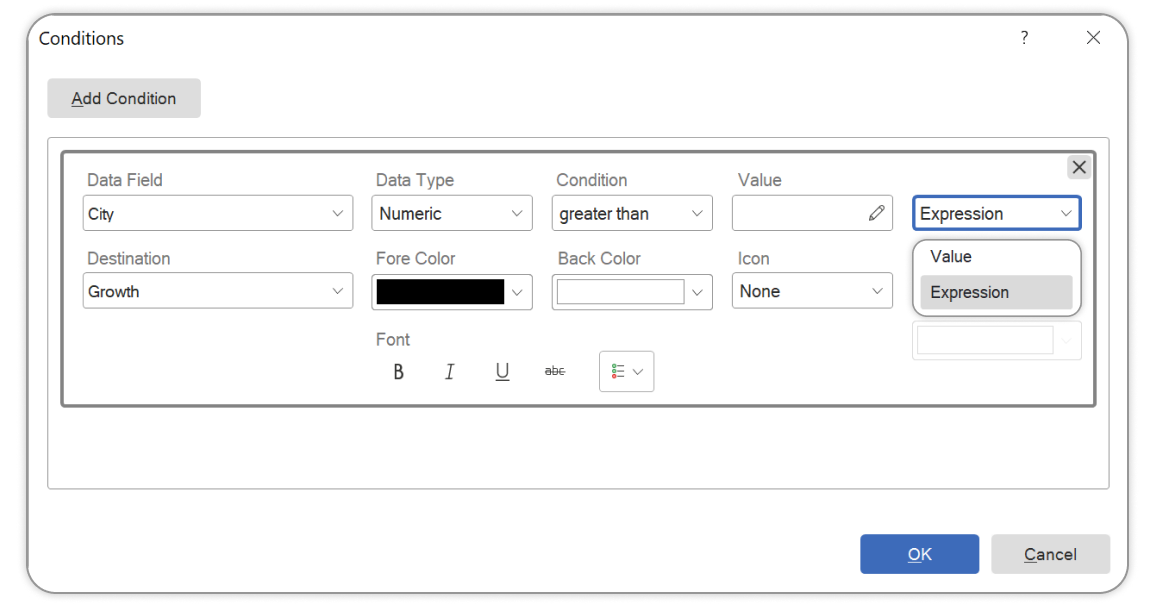
You can now use expressions in conditional formatting for the Pivot Table dashboard element. This allows you to create conditions based on variables and calculations instead of using only fixed values.
OData V4 in JavaScript
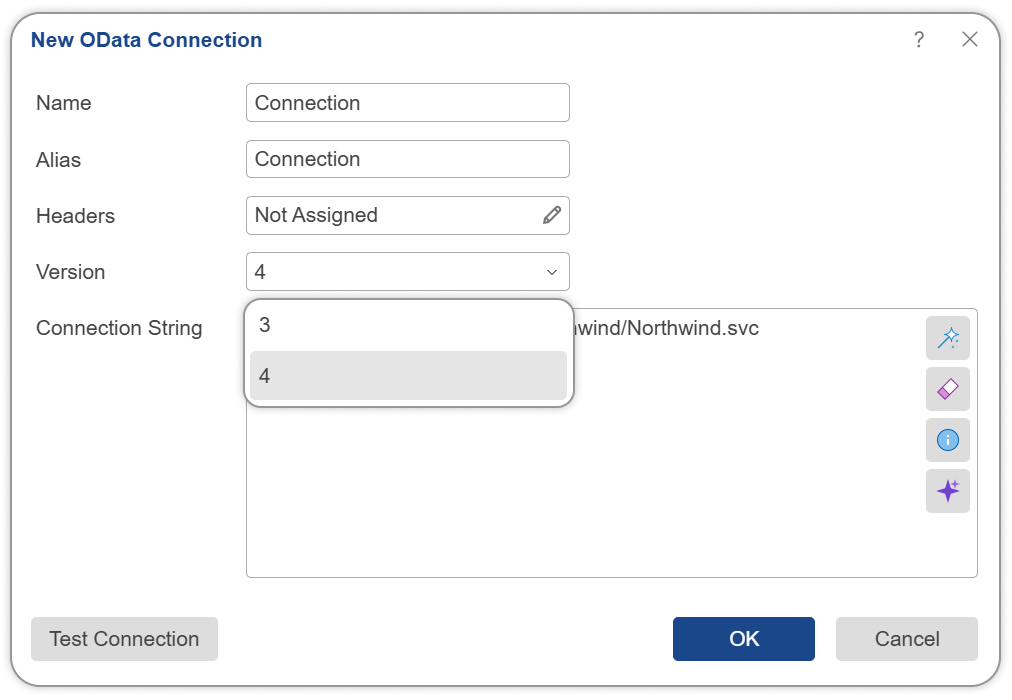
The JavaScript reporting tool now supports the OData V4 protocol. When creating a connection to an OData data source in the JavaScript designer, you can choose between OData V3 and V4.
Memory optimization in Web Components
We have reduced memory usage in web components by improving internal structures and updating caching mechanisms. Unused resources are now released faster. The StiOptions.Web.AllowGCCollect option has been improved. When enabled, it performs more intensive memory cleanup, helping control memory usage under heavy workloads.
Glyph Shaping in Java PDF export
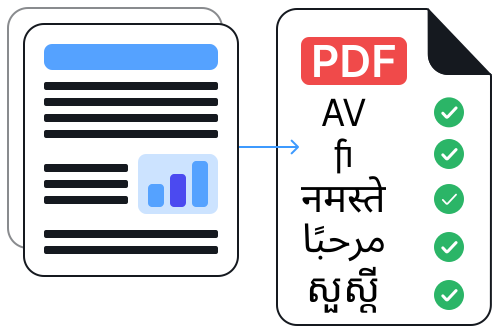
Stimulsoft Reports.JAVA now supports glyph shaping when exporting reports to PDF. This includes kerning, ligatures, and complex writing systems such as Arabic, Indic scripts, Khmer, and Myanmar. Text in these languages is now displayed in PDF files with the correct character connections and order.
Fonts in Stimulsoft Server Docker
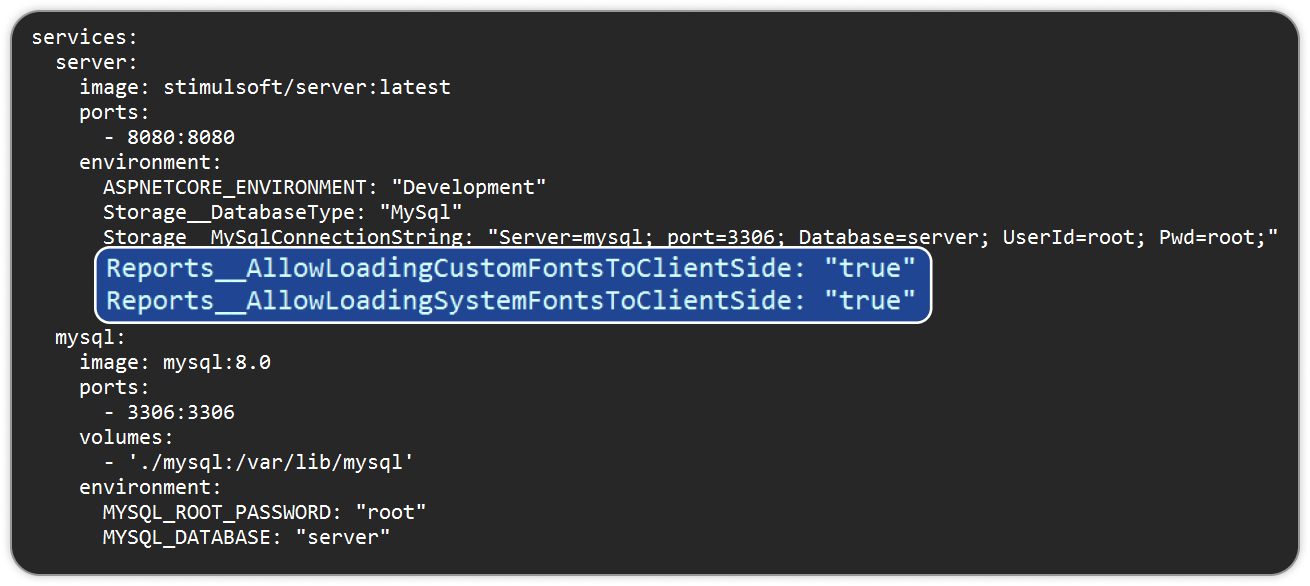
The Stimulsoft Server Docker image now includes the free, metrically compatible Liberation, Carlito, and DejaVu fonts. Previously, the image did not include fonts. As a result, reports using Arial or Times New Roman could appear with substitute fonts in the browser. Now, these reports look correct right after installation. Two new options, AllowLoadingCustomFontsToClientSide and AllowLoadingSystemFontsToClientSide, are also available to control the loading of custom and system fonts in the browser.
Multi-Term search in dashboard filters
The search fields in the ListBox and ComboBox dashboard elements now support multiple search terms separated by spaces. To search for an exact phrase, enclose it in double quotation marks.
Island of Ireland map
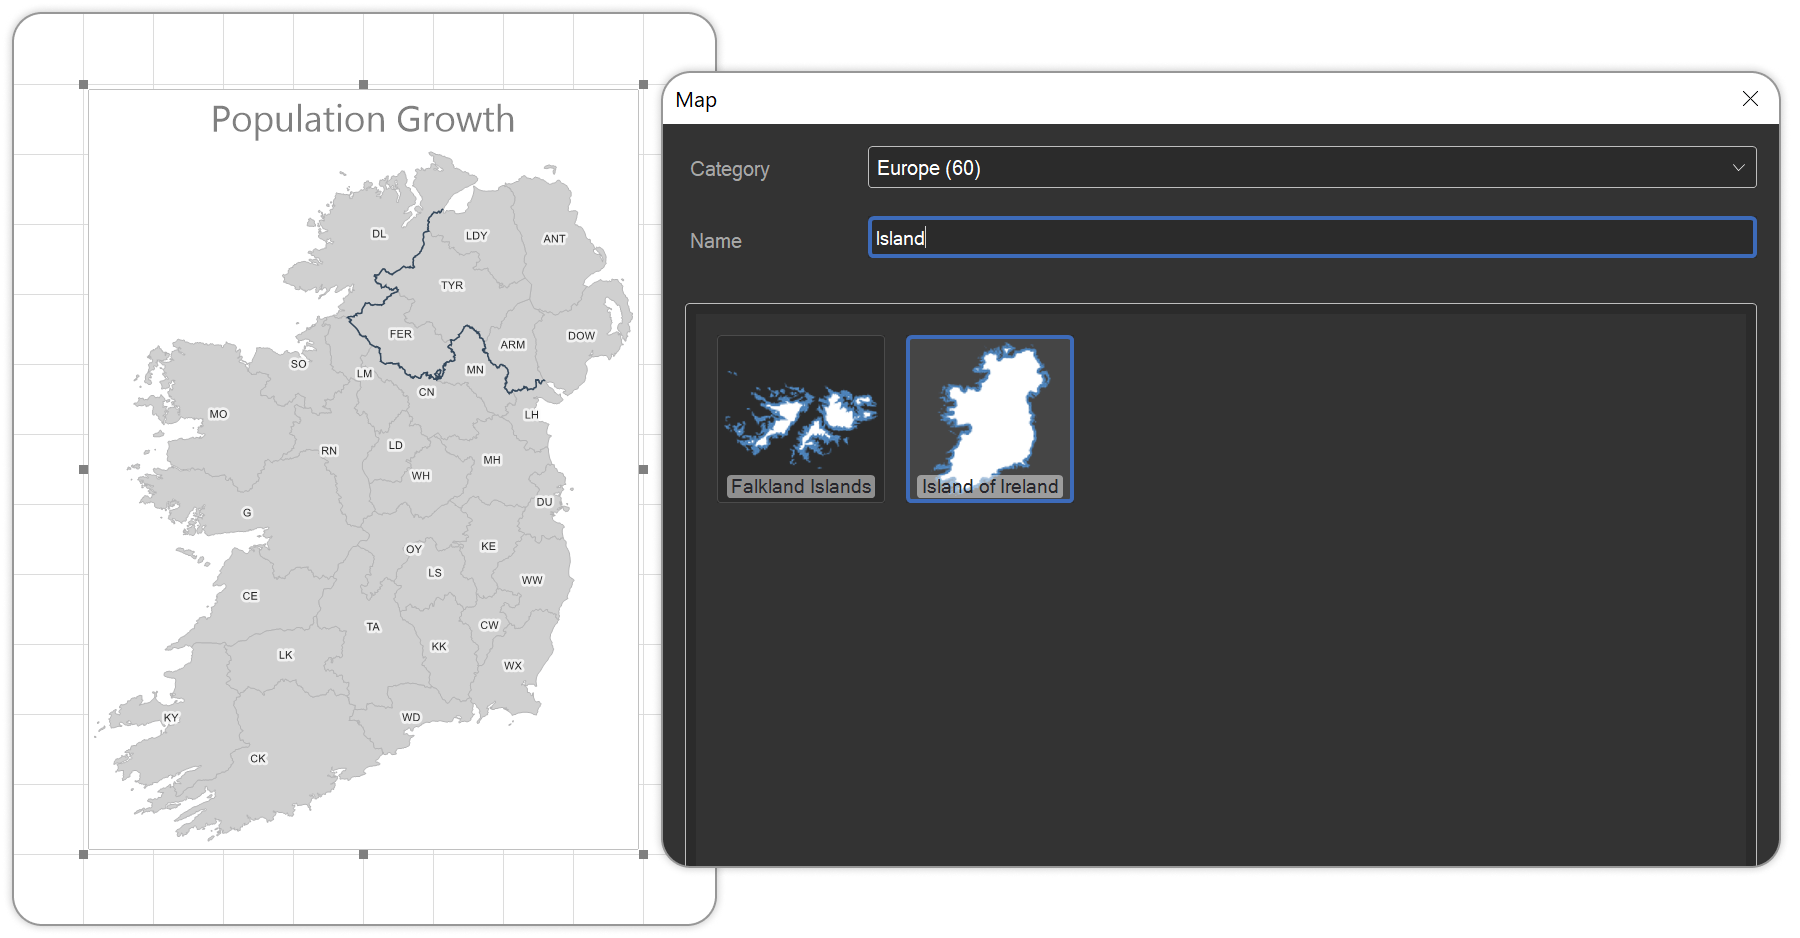
A new Island of Ireland map has been added. It covers the entire island, including the regions of Northern Ireland. The map is available in the Map report component and the Region Map dashboard element.
Markdown component
In version 2026.4.1, we have added a new Markdown component for reports. It allows you to display formatted text with headers, lists, tables, images, links, code blocks, and much more. The Markdown component supports the full official CommonMark 0.31.2 specification and the GitHub Flavored Markdown (GFM) extension. You can edit Markdown content directly in the component editor.
Sankey chart
A new chart type, Sankey, is now available in reports and dashboards. You may use it for visualizing budgets, resource flows, sales funnels, and more.
.NET 11 support
.NET 11 Release Candidate 1 was released on September 8, 2026. We have tested Stimulsoft components for compatibility with .NET 11 RC1. They can now be integrated into projects that use this new framework version.
Sparklines in Cross-Tab and Pivot Table
You can now display sparklines in cells of the Cross-Tab component in reports and the Pivot Table element in dashboards. These small charts show data trends directly in table cells, without the need for a separate chart.
Business Objects in JavaScript
Stimulsoft Reports.JS now allows you to register JavaScript objects from your application as business objects for reports and dashboards. The data dictionary is synchronized automatically, including nested objects and collections. This lets you pass data to reports in the same structure that is already used in your application.
New Chart types in Java
Stimulsoft Reports.JAVA now includes 17 additional chart types: Clustered Column, Stacked Column, Full Stacked Column, Line, Area, Wireframe Surface, Box and Whisker, Histogram, Pareto, Waterfall, Funnel Weighted Slices, Heatmap, Pictorial, Pictorial Stacked, Ribbon, Sunburst, Treemap. These new chart types make it easier to use the same report templates across different platforms, including .NET, JavaScript, and Java.
Relations from Foreign Keys
When you create an SQL data source or synchronize the data dictionary, relations are now created automatically based on foreign keys in the database. This feature supports MS SQL, MySQL, MariaDB, PostgreSQL, Oracle, Firebird, SQLite, SQL CE, Access, Teradata, Snowflake, DuckDB, and VistaDB. It also supports ODBC and OLE DB connections in .NET products and JDBC connections in Stimulsoft Reports.JAVA.
Expression Checker in Dashboards
Expression checking is now available in editors for dashboard elements such as Table, Cards, and Chart, among others. If an expression contains an error, a message appears below the input field. The Report Checker also checks expressions used in dashboard elements, including tooltips, hyperlinks, and interaction settings. It can report unknown functions, missing data columns, and errors in filters and conditions.
DuckDB adapter support
A new adapter for the DuckDB data source is now available. You can use DuckDB data to create reports and dashboards. Automatic import of relations from foreign keys is also supported.
Microsoft.Data.SqlClient adapter for MS SQL
You can now use the Microsoft.Data.SqlClient adapter to connect to MS SQL data sources. In .NET 6 and later, this adapter is used by default. In components for .NET Framework 4.6.2, you can enable it by setting StiOptions.Dictionary.UseMicrosoftDataSqlClient to true. In Stimulsoft Designer for Windows, select Microsoft.Data.SqlClient in the MS SQL Data Adapter setting on the Data tab in the Options window. This adapter provides new options, including support for SQL Server strict encryption (Encrypt=Strict).
Avalonia 12 support
The Stimulsoft components for AvaloniaUI have been updated to support Avalonia 12. Since Avalonia 12 includes breaking changes, starting with version 2026.4.1, Stimulsoft components support only this framework version. These components are included in Stimulsoft Ultimate.
Micro QR Code
Reports now support the Micro QR Code, a compact version of the QR code designed for small products and labels. It supports versions M1-M4, with automatic version selection, numeric, alphanumeric, and byte data, as well as L, M, and Q error correction levels. By default, the component selects the highest error correction level that allows the data to fit into the code.
WebP image support
Stimulsoft components for WinForms now support images in the WebP format. WebP images are displayed in the Designer and Viewer and can be exported correctly to PDF, Excel, HTML, and image formats. This support is provided through a separate Stimulsoft.WebP assembly available via NuGet.
Chart colors from data
In dashboards, you can now set chart element colors using values from a data column. The data source can provide colors as HEX or RGB codes or as names such as "Red" or "White". This option is available for Pie, Pie 3D, Doughnut, Funnel, Treemap, Sunburst, and Pareto charts, as well as clustered column and bar charts.
Smart Guides in Web Designer
Smart Guides have been added to the web report designer. When you move or resize a component, the guides show how it aligns with other components on the page. This makes it easier to position report elements accurately.
Functions MonthYear, QuarterYear, WeekYear, DayMonthYear
New functions are now available in reports and dashboards: MonthYear, QuarterYear, WeekYear, and DayMonthYear. They group data by month, quarter, week, or day while taking the year into account. This helps keep data in the correct chronological order. Labels are displayed according to the report's selected culture.
RowNumber and Rank functions
Two new functions, RowNumber() and Rank(), are now available in dashboards. RowNumber() returns the row number (1..N) in the final sorted result. Rank() ranks values in descending order: equal values receive the same rank, and the next rank is skipped, as in SQL. For example: 1, 2, 2, 4.
GetLabels function
The GetLabels function is now available for List variables displayed in the viewer's parameter panel. It returns the labels of selected items instead of their keys. You can then use these labels in queries and expressions. For example: GetLabels("Cities").ToQueryString()
Filters Window in Data Transformation
A new Filters window has been added to the Data Transformation editor. It allows you to set filter conditions for different data columns. You can combine conditions using the And and Or logical operators.
Expressions in Pivot Table conditions
You can now use expressions in conditional formatting for the Pivot Table dashboard element. This allows you to create conditions based on variables and calculations instead of using only fixed values.
OData V4 in JavaScript
The JavaScript reporting tool now supports the OData V4 protocol. When creating a connection to an OData data source in the JavaScript designer, you can choose between OData V3 and V4.
Memory optimization in Web Components
We have reduced memory usage in web components by improving internal structures and updating caching mechanisms. Unused resources are now released faster. The StiOptions.Web.AllowGCCollect option has been improved. When enabled, it performs more intensive memory cleanup, helping control memory usage under heavy workloads.
Glyph Shaping in Java PDF export
Stimulsoft Reports.JAVA now supports glyph shaping when exporting reports to PDF. This includes kerning, ligatures, and complex writing systems such as Arabic, Indic scripts, Khmer, and Myanmar. Text in these languages is now displayed in PDF files with the correct character connections and order.
Fonts in Stimulsoft Server Docker
The Stimulsoft Server Docker image now includes the free, metrically compatible Liberation, Carlito, and DejaVu fonts. Previously, the image did not include fonts. As a result, reports using Arial or Times New Roman could appear with substitute fonts in the browser. Now, these reports look correct right after installation. Two new options, AllowLoadingCustomFontsToClientSide and AllowLoadingSystemFontsToClientSide, are also available to control the loading of custom and system fonts in the browser.
Multi-Term search in dashboard filters
The search fields in the ListBox and ComboBox dashboard elements now support multiple search terms separated by spaces. To search for an exact phrase, enclose it in double quotation marks.
Island of Ireland map
A new Island of Ireland map has been added. It covers the entire island, including the regions of Northern Ireland. The map is available in the Map report component and the Region Map dashboard element.