Creating reports and dashboards | Stimulsoft community forum
Reporting tool and data analytics tools for creating reports and dashboards in ASP.NET, ASP.NET MVC, .NET Core, Blazor, Angular, PHP, Python, WPF, JavaScript, and Java applications.
Hello,
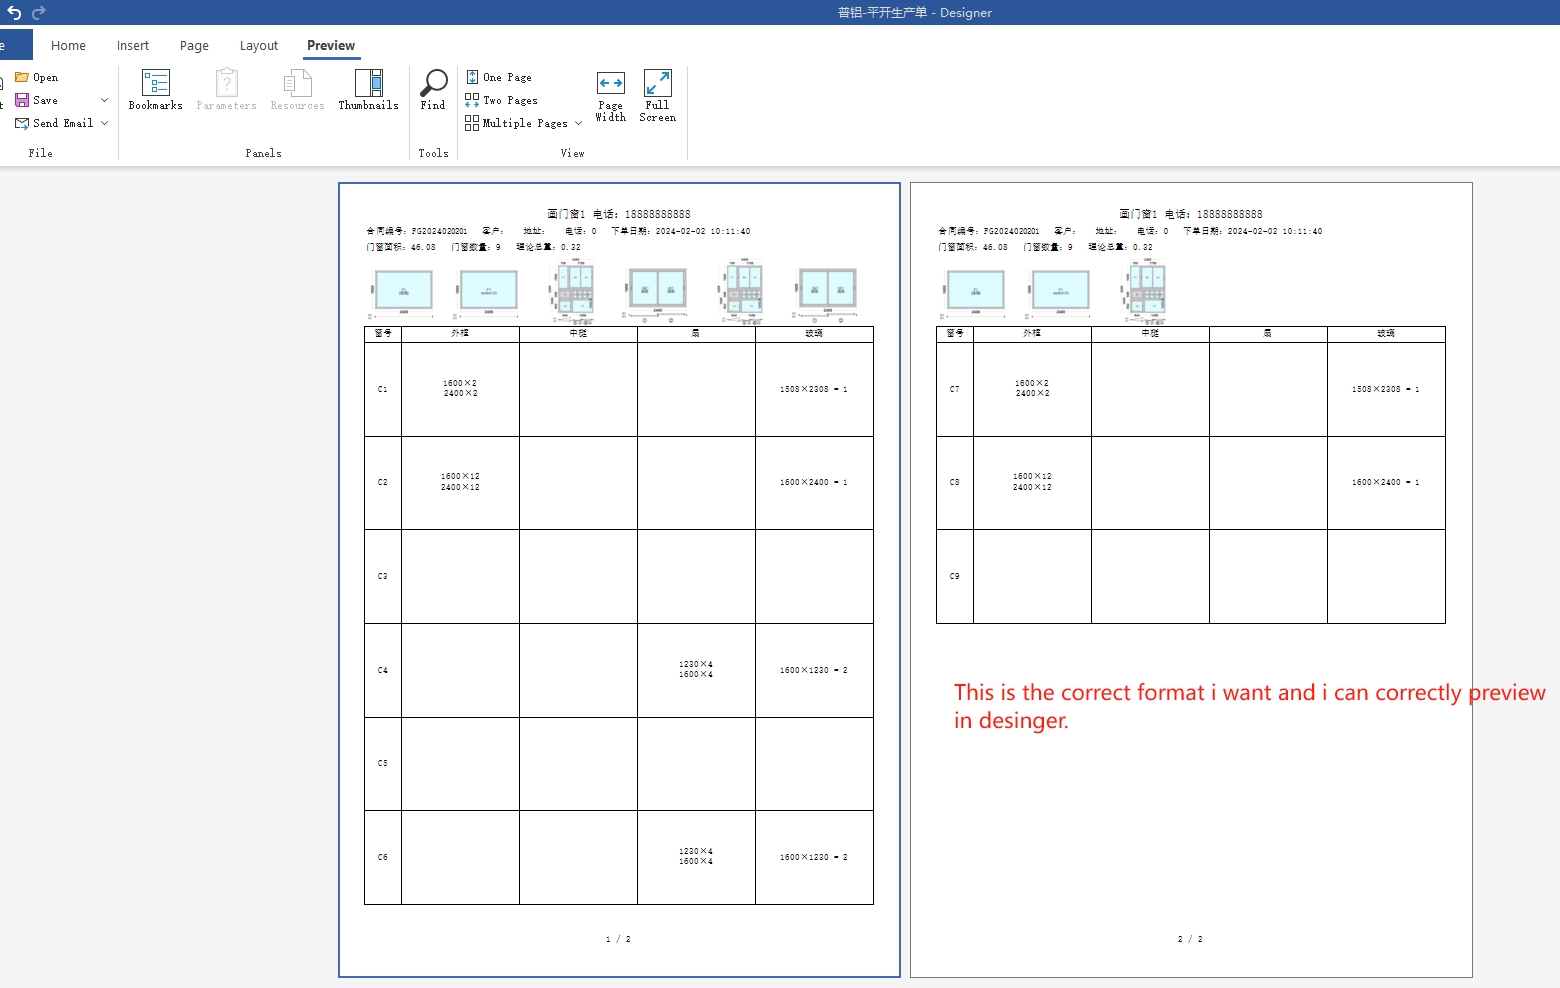
I'm creating a report with fixed header.
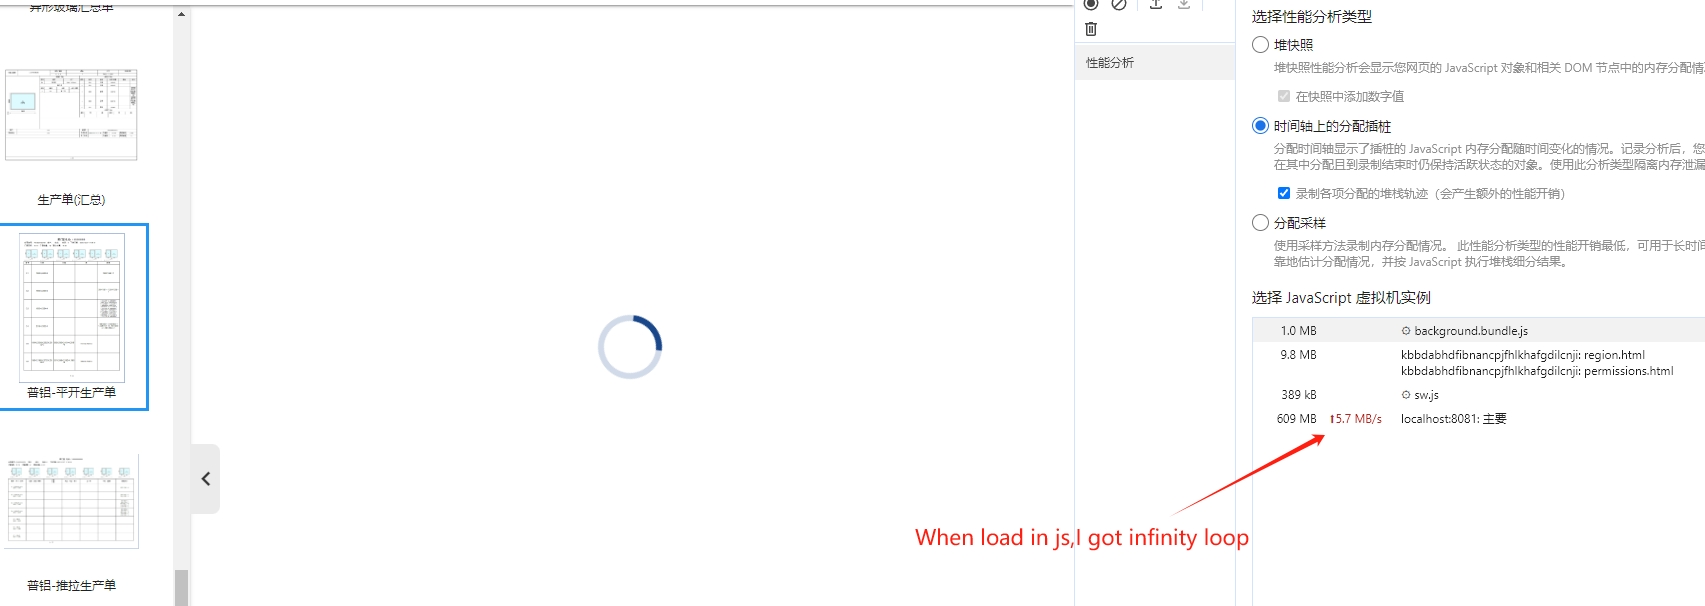
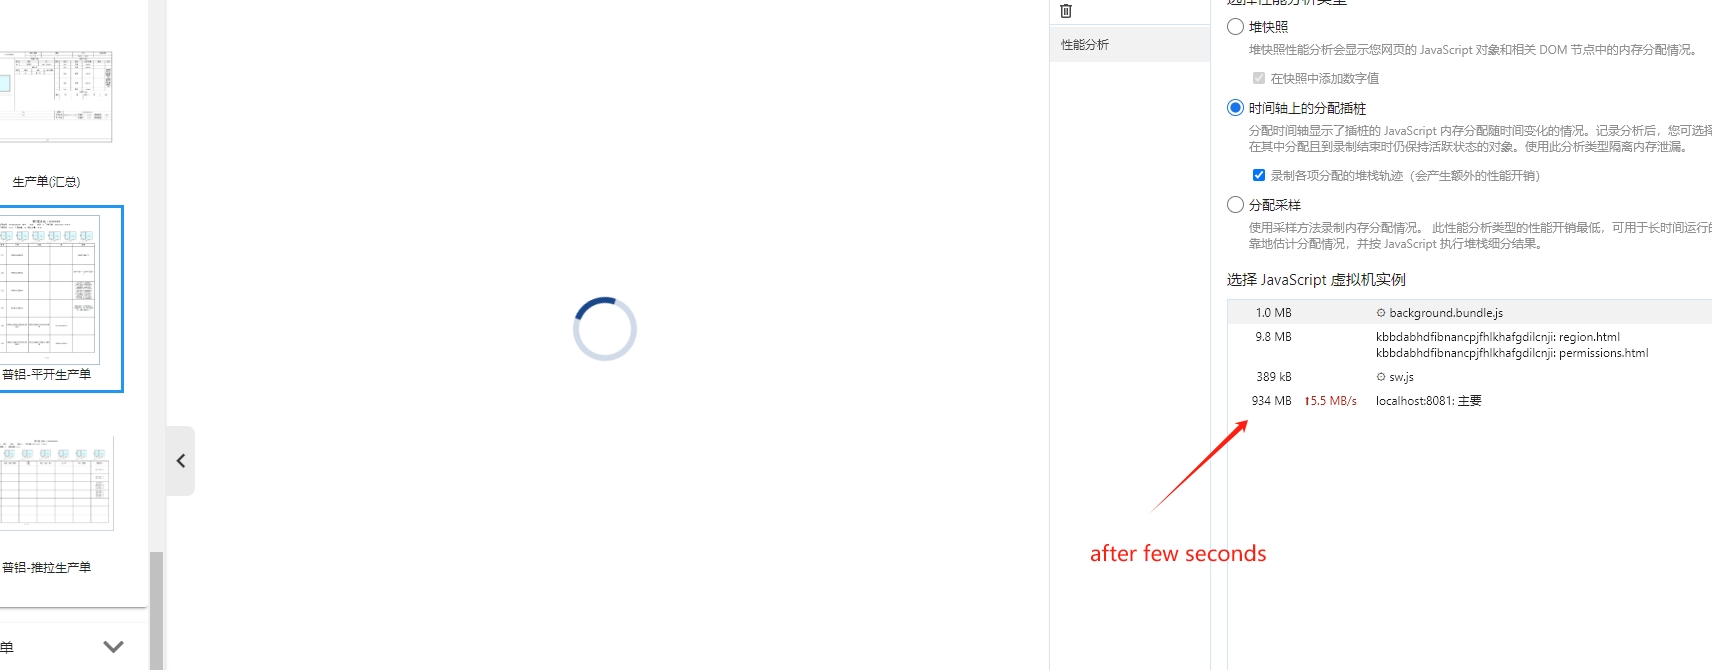
It works well when i preview in desinger,however,when load in report&viewer.js,i got a Infinite loop and the page can not show and takes large amount of memory.
Look at this below.
The main problem: the same data source is used in several bends at once.
Our product is technically designed so that the current position is stored in the data source, not in the band.
But if the second band starts working before the first band has completely worked - the second band changes the position in the source, disrupting the work of the first band, and it most often stops its work, not outputting all the data to the end.
To solve the problem in this case, it is necessary to make a copy of the data source and assign this copy to the second band.
In this report, there are several such bends at once. One pair spins data on the page, the second in the PageHeader.
We have added fixes in this direction. It will be available in the next build.
But you still need to make a copy of the data sources to render all the data, at the same time the problem with freezing on the current build will be solved.
The second problem is the "Line / 7 == PageNumber - 1" expression is written in the Enabled property of the image.
This works correctly in Net as integer division. But JS has math for fractional numbers only.
To make it work correctly in JS, you need to change the expression: (int)(Line / 7) == PageNumber - 1